")
Did you know that according to a McKinsey Global Institute report, businesses that leverage data analytics outperform their competitors by a whopping 23% in terms of profitability?
That’s a significant jump!
But here’s the catch: just having data isn’t enough.
Traditionally, analyzing data meant wrestling with complex spreadsheets and siloed information – not exactly a recipe for success.
This is where Customer Relationship Management (CRM) software like HubSpot comes in. CRM centralizes all your customer interactions – website visits, email exchanges, support tickets – in one place, eliminating data silos and providing a holistic view of your audience.
But the power doesn’t stop there.
HubSpot Data Analytics takes things a step further, offering a user-friendly platform that transforms raw data into actionable insights.
Therefore, forget the days of data-driven decision making feeling like a guessing game.
HubSpot Data Analytics empowers you to truly understand your customers, optimize your platform, and achieve real business growth.
So, let’s dive in!
All About HubSpot Data Analytics
Is your customer data feeling like it’s locked away in a forgotten storage room, difficult to access and understand?
Fear not, marketer, salesperson, or customer service representative!
Similarly, data analytics for insurance helps insurers unlock critical insights from policyholder data, allowing them to optimize risk assessment and claims processing.
So, what exactly is HubSpot Data Analytics?
Think of it as your personal data translator.
It takes all the customer interactions scattered across HubSpot CRM – website visits, support tickets, email chains (we’ve all been there) – and translates them into a clear, concise language. But it doesn’t stop at basic translation!
Imagine data visualization as the glitter raining down at the disco. Charts, graphs, and other visual magic transform complex data into easily digestible information.
Therefore, no more squinting at endless spreadsheets – these insights hit you right between the “eyes” (in a good way!).
Now, let’s talk about the benefits!
HubSpot Data Analytics isn’t just about fancy data displays. It’s about giving you the power to truly see your customers.
You’ll get a bird’s-eye view of their entire journey – from their first website visit to their latest support interaction.
That is to say, this newfound customer visibility lets you tailor your approach and make informed decisions across all departments:
- Sales: No more nurturing leads in the dark!
HubSpot Data Analytics reveals which leads are most engaged, allowing you to focus your efforts and close more deals.
- Marketing: Say goodbye to campaign guesswork!
Analytics helps you see what resonates with your audience, so you can optimize campaigns and maximize ROI.
- Customer Service: Stop prioritizing support tickets based on a hunch. HubSpot Data Analytics identifies your most valuable customers and helps you prioritize their needs.
But wait, there’s more!
HubSpot Data Analytics doesn’t just tell you what’s happening; it tells you what to do next. In addition, based on trends and patterns, it generates actionable insights.
So, think of it as your personal data guru, whispering strategic recommendations in your ear (much cooler than a spreadsheet ever could be).
Now, let’s peek behind the curtain and explore the key features:
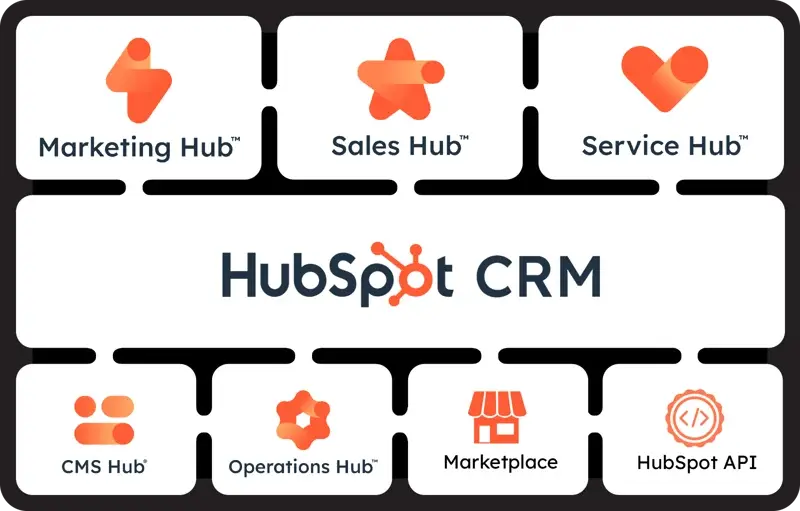
HubSpot CRM transcends the realm of a simple customer relationship management tool. It’s a conductor, meticulously guiding you in composing a harmonious customer journey – a journey that transforms from a jumbled mess of interactions into a well-rehearsed symphony.
Therefore, let’s delve deep into its key features and explore how they elevate your customer experience:
HubSpot CRM isn’t just another customer relationship management tool; it’s a conductor, guiding you in creating a harmonious customer journey.
So, here’s a closer look at its key features and how they can elevate your experience:
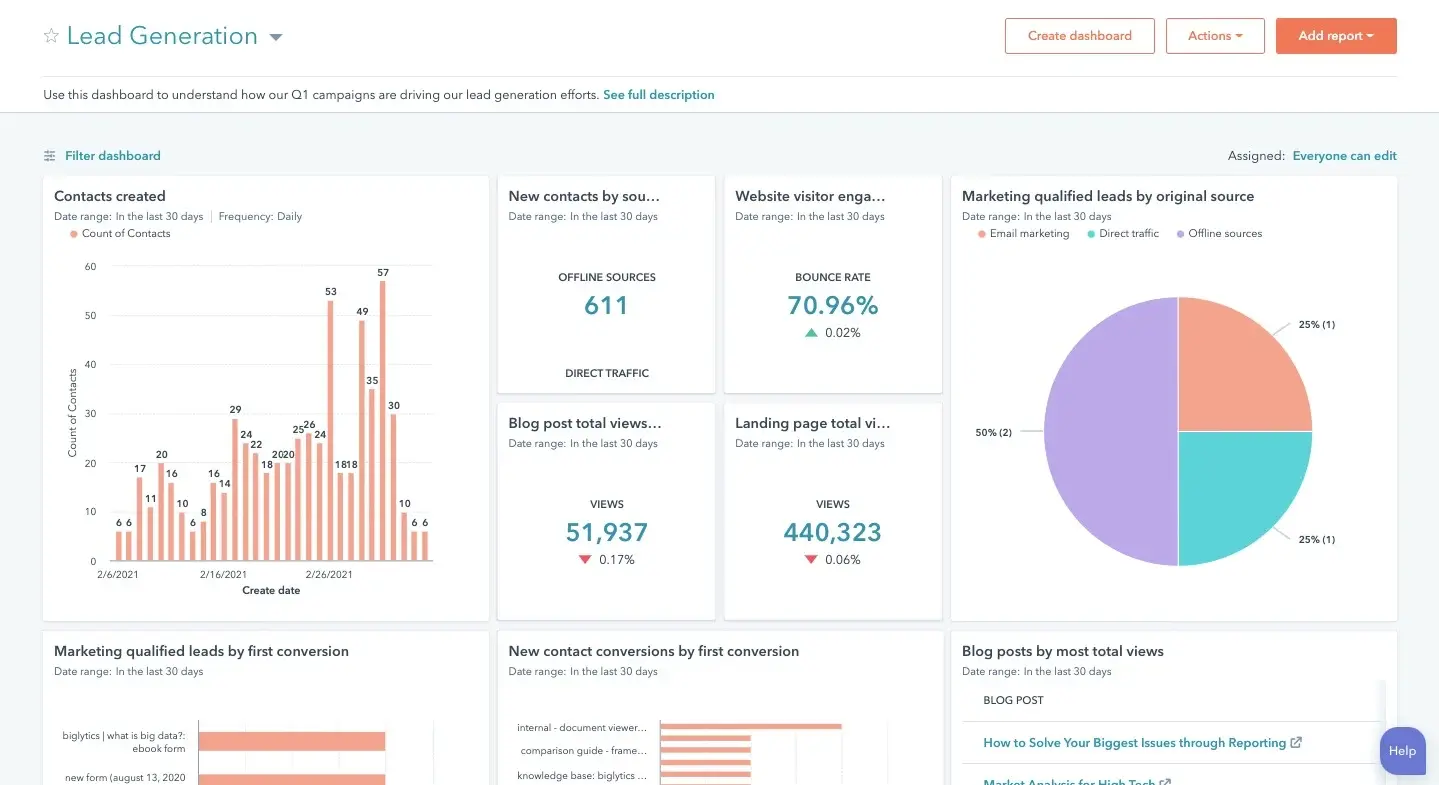
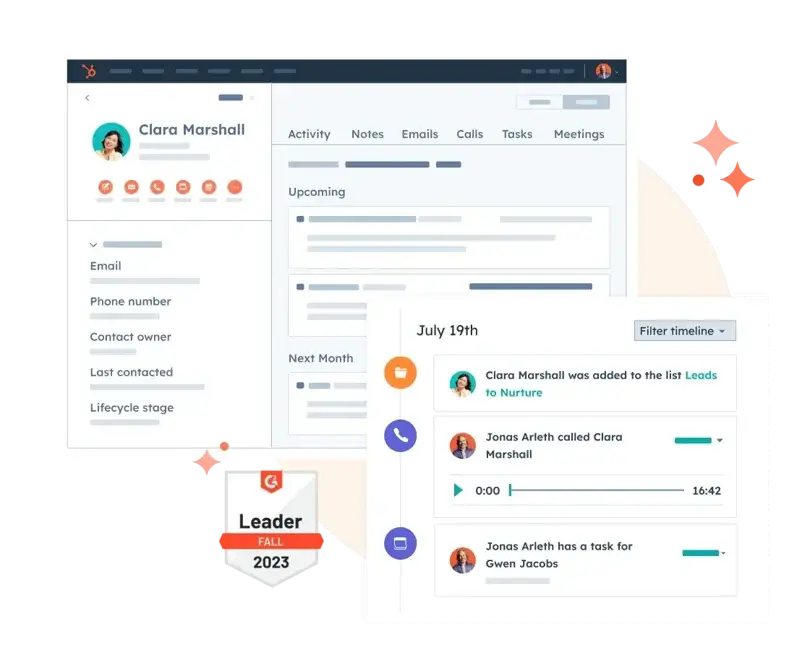
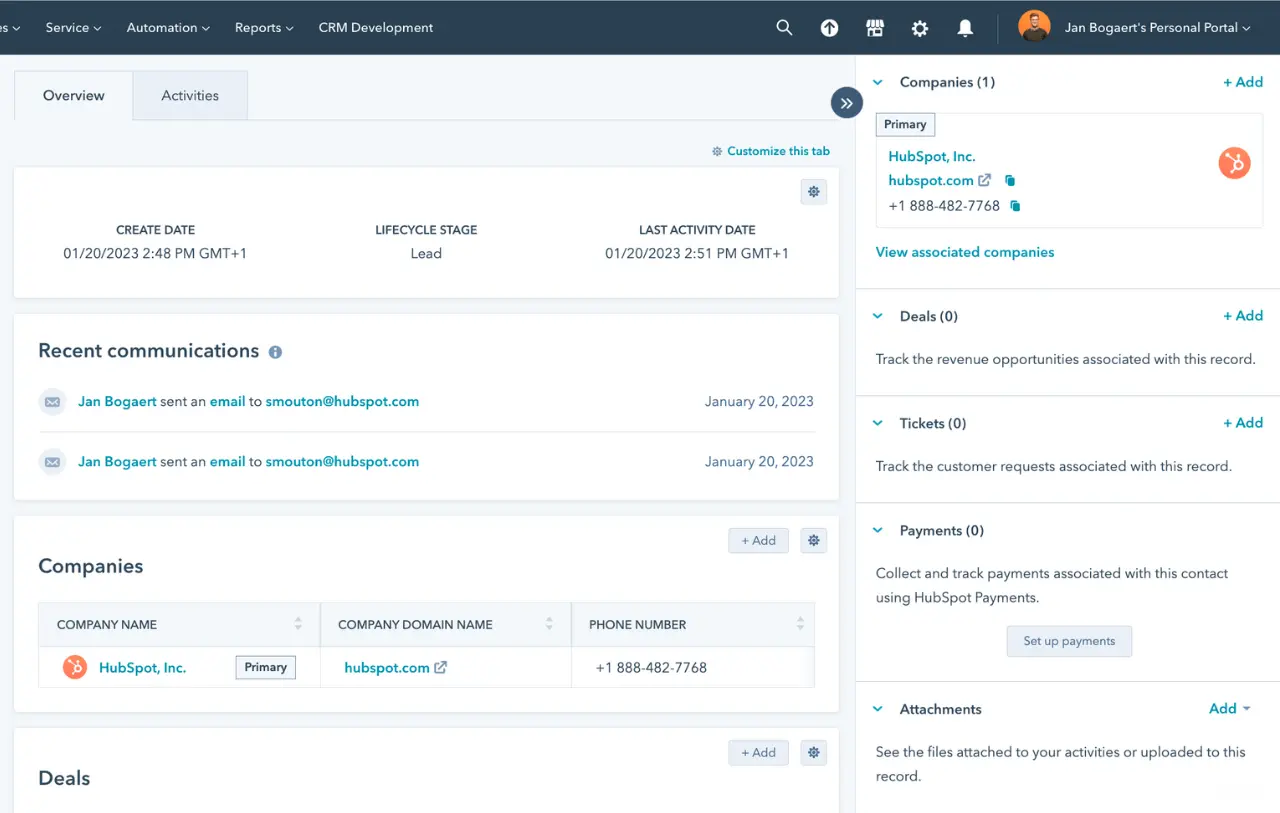
1. Intuitive Dashboards: Real-Time Insights at Your Fingertips
- Crystal-Clear Visibility: Pre-built dashboards provide key metrics like lead generation, deal conversion rates, and customer satisfaction levels at a glance. So, no more data mining required!
- Actionable Guidance: Identify trends and potential roadblocks with ease. That is to say, these dashboards proactively nudge you towards opportunities and help course-correct before issues snowball.
- Customization Options: Prioritize the metrics that matter most to your unique business goals with some dashboards offering customization options.
2. Customizable Reporting: Dive Deeper for Actionable Insights
- Granular Analysis: Craft reports specific to your needs. Analyze marketing campaign effectiveness or drill down into customer demographics by region. HubSpot empowers you to find the answers.
- Advanced Filtering: Isolate specific trends and identify hidden patterns. In addition, filter your data by various criteria like date range, product line, or customer segment for a deeper understanding.
- Compelling Visualization: Present your findings in a clear and impactful way with various chart formats. Furthermore, foster stakeholder buy-in with easy-to-understand data visualizations.
3. Data Filtering and Segmentation: Personalization – The Key to Customer Loyalty
- Demographic Targeting: Tailor your marketing messages and offerings to resonate with specific customer segments by filtering data by age, location, income level, or job title.
- Behavioral Targeting: Understand customer actions! Moreover, segment data based on past purchases, website interactions, or support tickets to create targeted campaigns that address their specific needs and interests.
- Actionable Segmentation: Leverage segmented data for personalization. In other words, send targeted email campaigns, offer product recommendations tailored to individual needs, or adapt website content to resonate with each segment.
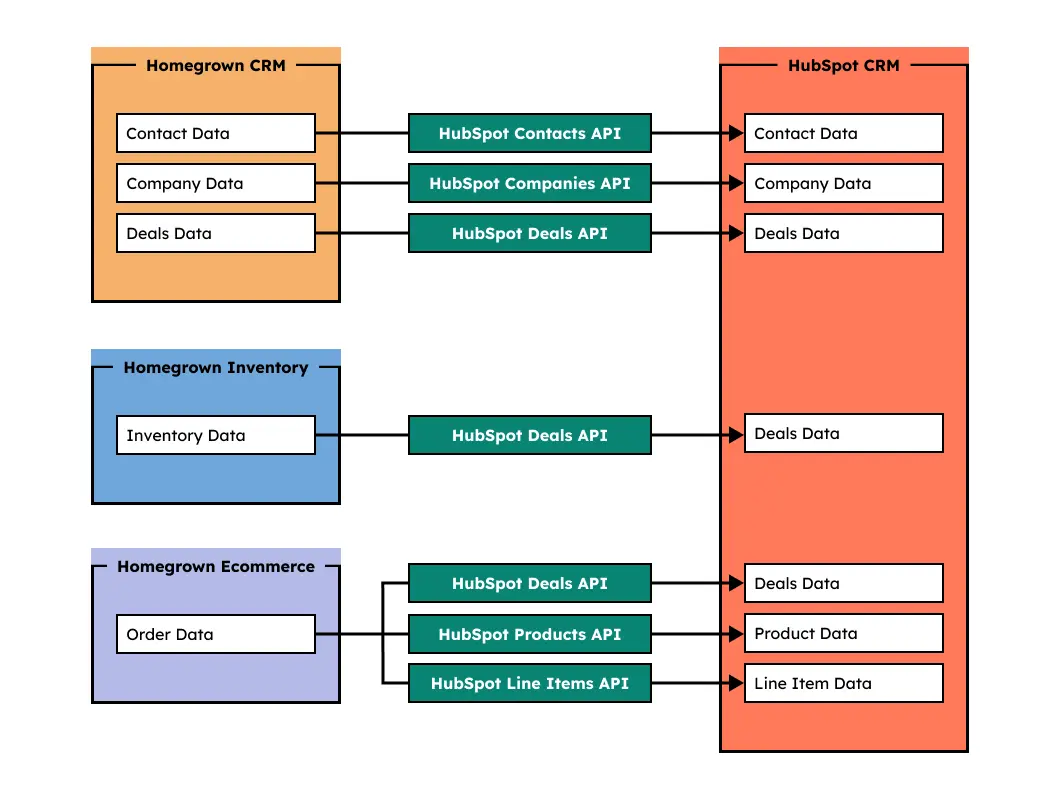
4. Integrations: A Symphony of Data, Playing in Harmony
- Streamlined Data Flow: Eliminate manual data entry between different systems with seamless integrations. So, ensure your CRM has the most up-to-date customer information for better decision-making.
- Unified Customer Profile: Gain a complete picture of your customer interactions across all touchpoints by connecting your CRM with marketing automation tools, sales platforms, and support systems.
- Automated Workflows: Free up valuable time and resources. Also automate tasks and workflows, like creating sales leads from website forms or triggering targeted marketing campaigns based on customer behavior within your CRM.
Beyond the Features: The Transformative Power of HubSpot Data Analytics
The aforementioned features are just the opening act in HubSpot CRM’s capabilities.
In other words, by leveraging its full potential, you can orchestrate a customer journey that transcends mere transactions.
Here’s how:
- Improved Sales Efficiency
Shorten sales cycles, streamline deal management, and boost close rates with powerful sales automation tools.
That is to say, automate tasks like sending follow-up emails, scheduling meetings, and generating quotes, allowing your sales team to focus on closing deals.
- Enhanced Marketing ROI
Accurately measure the effectiveness of your marketing efforts across various channels. HubSpot CRM provides detailed analytics that help you identify what’s working and what’s not.
So, optimize your campaigns for better results and maximize your return on investment.
- Exceptional Customer Service
Deliver timely and personalized support across all channels, fostering customer loyalty.
Moreover, with a unified customer profile and readily available communication history, your support team can provide informed and efficient assistance, building stronger customer relationships.
- Data-Driven Decisions
Gain a competitive advantage by making data-driven decisions. HubSpot CRM empowers you to analyze customer behavior, track campaign performance, and measure key metrics.
Furthermore, use these insights to inform your strategies and ensure your business stays ahead of the curve.

Getting Started with HubSpot Data Analytics (Step-by-Step Guide)
1. Integrate HubSpot with Your Data Sources
Why Integrate?
Integration ensures that HubSpot can pull in data from your various business tools, giving you a comprehensive view of customer interactions and helping you track performance across multiple channels.
Steps
- Navigate to Integrations:
- Go to your HubSpot dashboard.
- Click on the gear icon (Settings) in the top right corner.
- Under “Account Settings,” find “Integrations” and select “Connected apps.”
- Connect Relevant Applications:
- Click on “Connect an app” and search for the tools you use (e.g., Gmail, Shopify, Mailchimp).
- Follow the prompts to authorize HubSpot to access data from these applications.
- Set Up Tracking Code:
- For website tracking, go to “Settings” > “Tracking Code.”
- Copy the HubSpot tracking code and paste it into the header of your website’s HTML. Moreover, if you’re using a CMS like WordPress, you might use a plugin like “Insert Headers and Footers” to add the code easily.
2. Define Key Interactions
Why Define Key Interactions?
Defining key interactions allows you to focus on the events that matter most for your business, such as lead generation or customer engagement.
Steps
- Identify Important Metrics:
- Decide which actions on your website or in your emails you want to track. Examples include form submissions, page views, or product purchases.
- Create Events:
- Go to “Reports” > “Analytics Tools” > “Events.”
- Click “Create event” and define the event you wish to track. For example, track when users complete a contact form or download a whitepaper.
3. Set Up Tracking for Emails and Forms
Why Track Emails and Forms?
Tracking emails and forms helps you understand how your audience interacts with your content, allowing you to optimize your communication strategies.
Steps
- Email Tracking:
- Go to “Marketing” > “Email.”
- Create a new email or edit an existing one.
- Ensure that “Track email opens” and “Track clicks” are checked. That is to say, this will allow you to see who is engaging with your emails.
- Form Tracking:
- Go to “Marketing” > “Forms.”
- Create a new form or edit an existing one.
- Ensure that your form settings are configured to track submissions, such as setting up follow-up emails or notifications for each form submission.
4. Configure Contact and Deal Properties
Why Customize Properties?
Customizing properties ensures you capture the specific information that is relevant to your business, allowing for more detailed analysis and segmentation.
Steps
- Customize Properties:
- Go to “Contacts” > “Contact Settings.”
- Click on “Properties” and add or edit properties to include specific fields like “Lead Source” or “Deal Stage.”
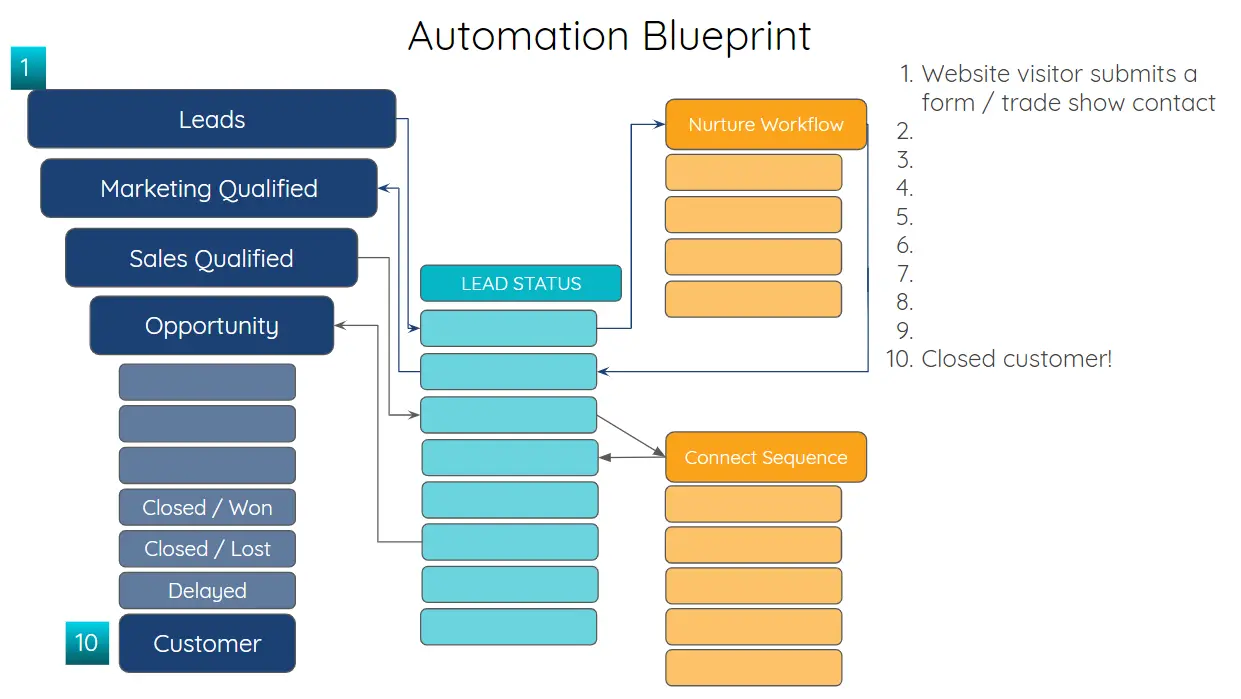
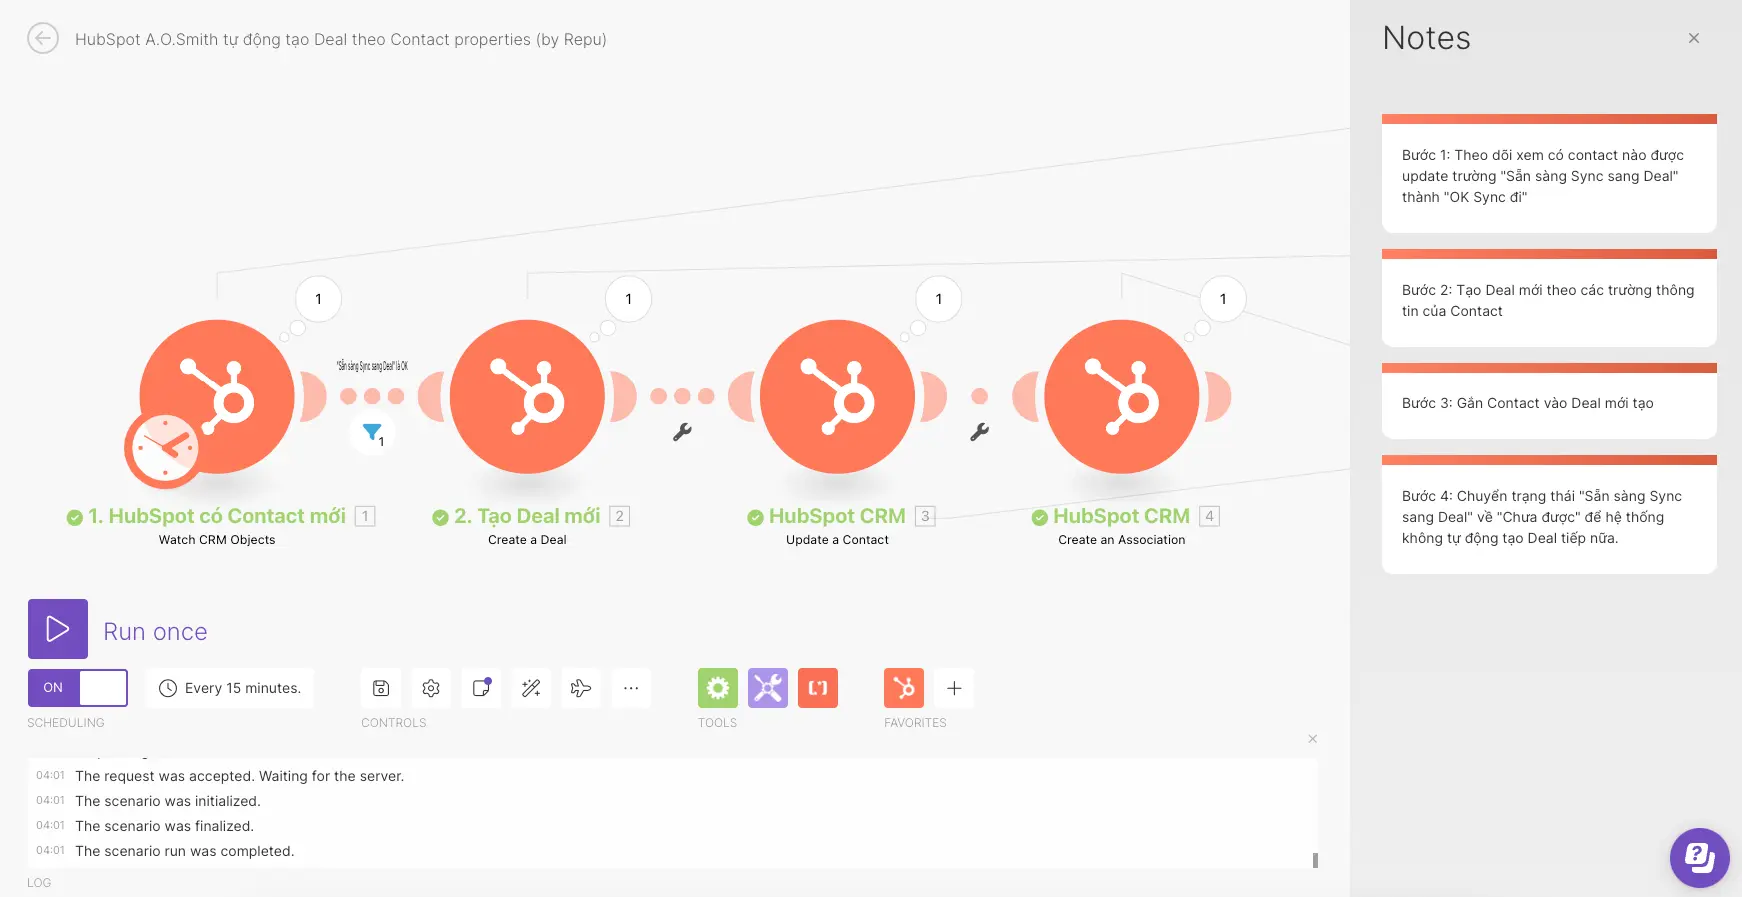
- Use Workflow Automation:
- Navigate to “Automation” > “Workflows.”
- Create workflows that update properties automatically. For example, set up a workflow to update a contact’s status from “Lead” to “Customer” once they make a purchase.
Building Reports and Dashboards
1. Navigate to the Reports Section
Why Create Reports?
Reports provide insights into your business performance, helping you track key metrics and make data-driven decisions.
Steps
- Access Reports:
- Click on “Reports” in your HubSpot dashboard.
- Select “Reports” from the dropdown menu to access existing reports or create new ones.
- Create a New Report:
- Click on “Create Report” to start a new custom report.
2. Choose a Report Type
Why Choose the Right Report Type?
Different report types help you analyze various aspects of your data, such as individual datasets or cross-object relationships.
Steps
- Select Report Type:
- Single Data Set Reports: Useful for simple metrics like contact properties or deal amounts.
- Cross-Object Reports: Great for analyzing relationships between different datasets, like comparing sales by contact and deal properties.
- Funnel Reports: Ideal for visualizing the progress of leads through your sales pipeline.
3. Build Custom Reports
Why Build Custom Reports?
Custom reports let you tailor your data analysis to specific business needs, helping you track metrics that matter most to you.
Steps
- Select Data Source:
- Choose from contacts, companies, deals, or tickets based on what you want to analyze.
- Add Filters:
- Apply filters to narrow down the data. For example, filter contacts by lifecycle stage to see only leads or customers.
- Customize Fields:
- Drag and drop fields to include in your report. Choose visualization types such as tables, bar charts, or pie charts to display your data effectively.
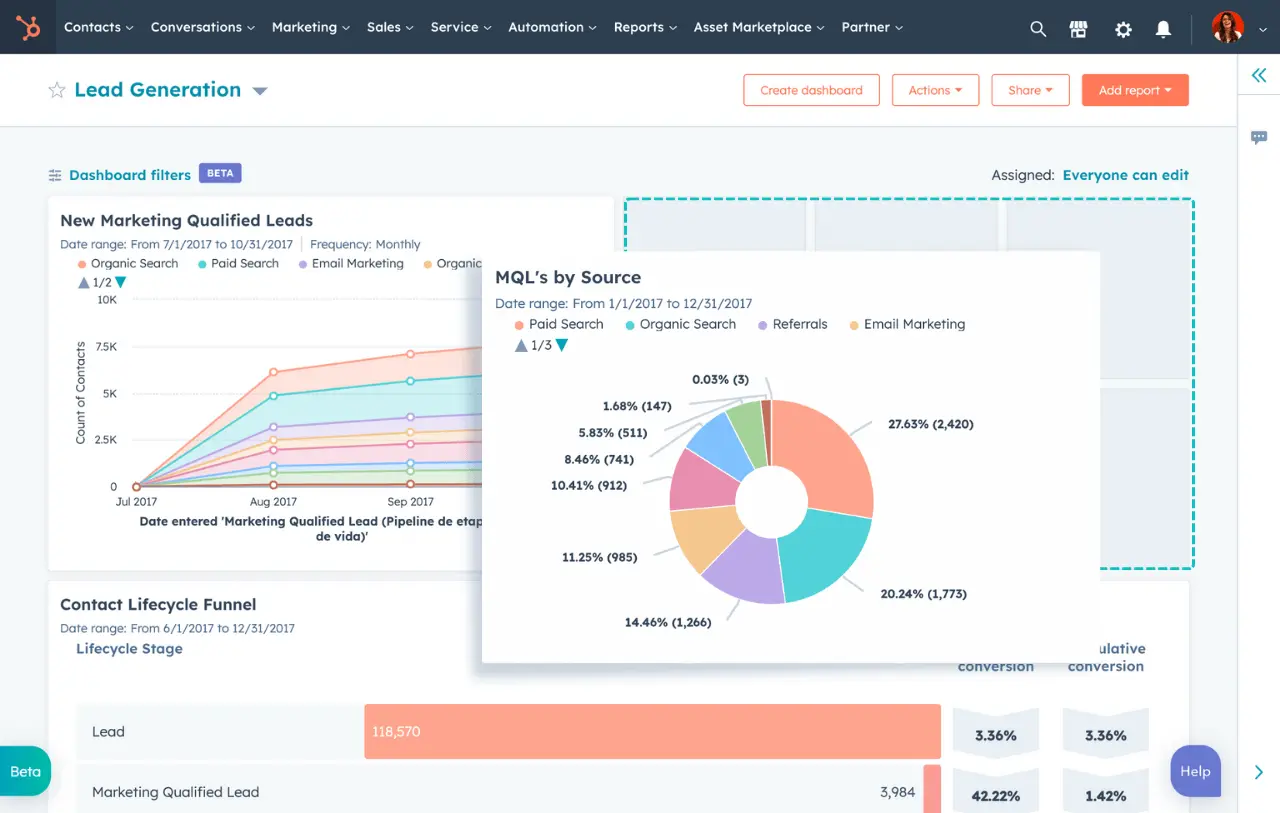
4. Create and Configure Dashboards
Why Use Dashboards?
Dashboards consolidate your reports into one place, giving you a comprehensive view of your business metrics at a glance.
Steps
- Access Dashboards:
- Go to “Reports” > “Dashboards.”
- Create New Dashboard:
- Click “Create Dashboard.”
- Give it a name (e.g., “Sales Performance”) and choose a layout that suits your needs.
- Add Reports to Dashboard:
- Click “Add Report” and select the reports you want to include. Arrange them for easy viewing.
- Customize Layout:
- Drag and drop reports to rearrange them. Moreover, adjust the size and position for optimal layout.
5. Set Up Dashboard Filters
Why Use Dashboard Filters?
Filters help you view specific slices of your data across multiple reports, making it easier to compare and analyze trends.
Steps
- Add Filters:
- In your dashboard, click “Add filter” to select criteria such as date range or contact properties.
- Save and Share:
-
- Save your dashboard and share it with team members by clicking “Share.” Moreover, you can set permissions to control who can view or edit the dashboard.
-
Data Analysis and Interpretation
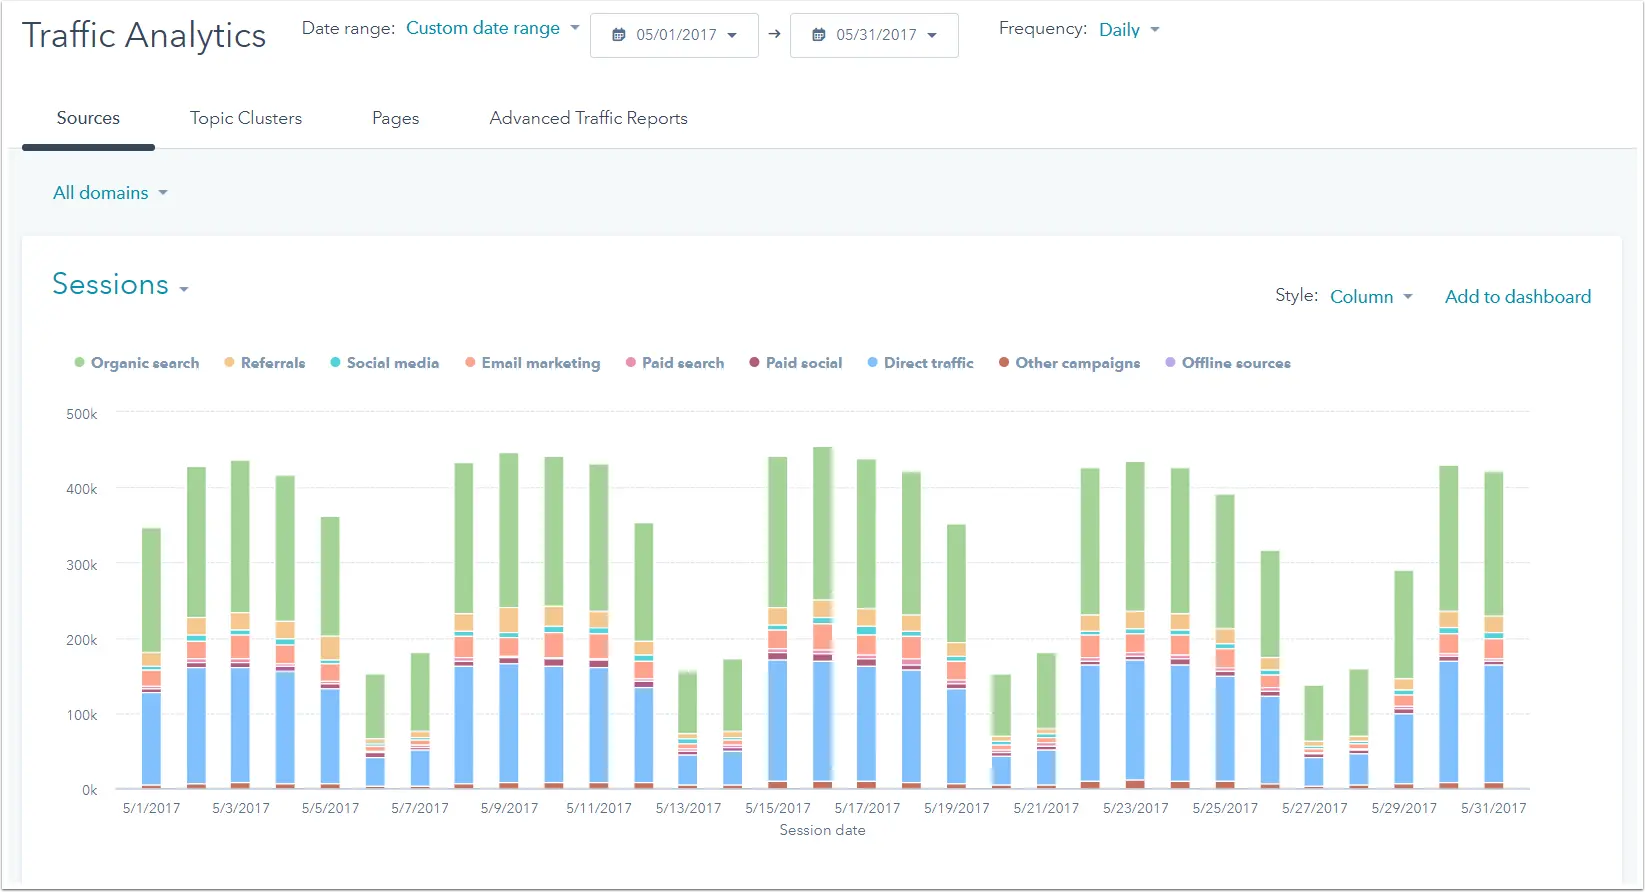
1. Understand Your Data Visualizations
Why Understand Visualizations?
Knowing how to read different types of visualizations helps you quickly grasp key insights from your data.
Steps
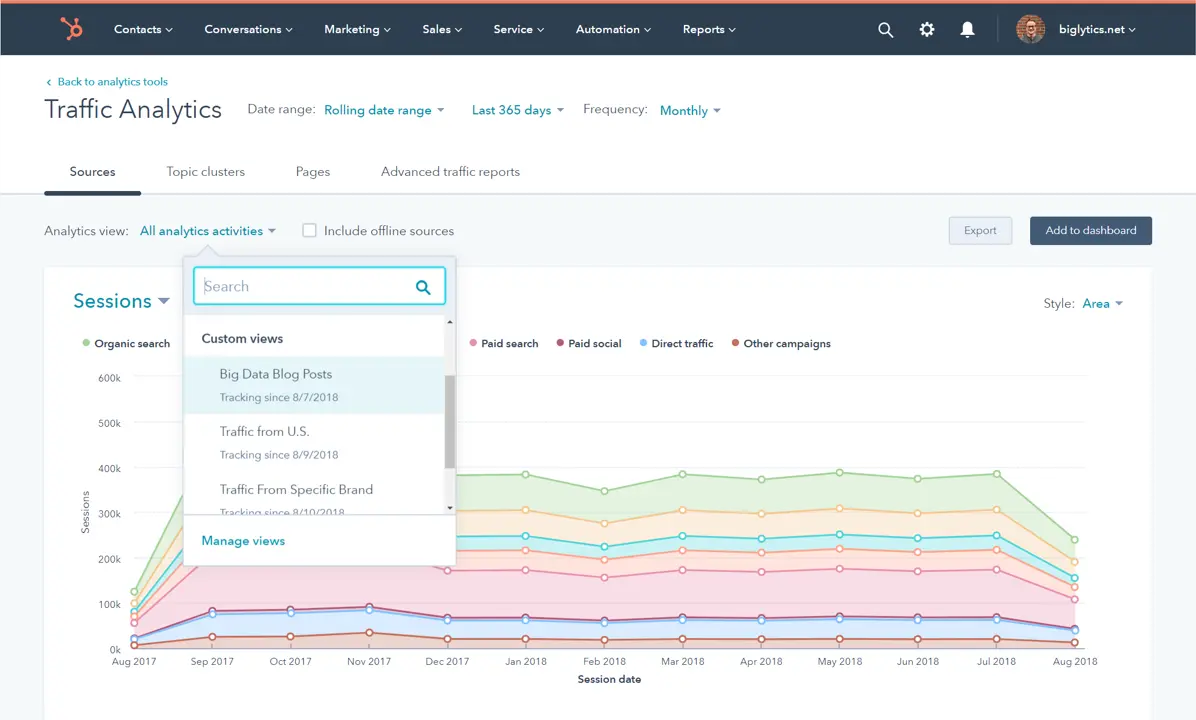
- Charts and Graphs:
- Bar Charts: Useful for comparing quantities across categories, like sales per product.
- Line Charts: Great for showing trends over time, such as monthly revenue.
- Pie Charts: Ideal for displaying proportions, like market share by segment.
- KPIs and Metrics:
- Identify and monitor key performance indicators such as lead conversion rates, average deal size, or customer acquisition costs.
2. Identify Trends and Patterns
Why Identify Trends?
Recognizing trends helps you anticipate changes and make proactive business decisions.
Steps
- Look for Trends:
- Examine data over different time periods to identify upward or downward trends. For instance, analyze website traffic over the last year to see seasonal patterns.
- Compare Segments:
- Use segmentation to compare different groups, such as high-value vs. low-value customers, to understand their behavior and needs.
3. Spot Outliers and Anomalies
Why Identify Outliers?
Outliers can highlight areas of concern or unexpected opportunities that need further investigation.
Steps
- Identify Outliers:
- Look for data points that stand out from the rest. For example, a sudden spike in customer complaints might indicate a product issue.
- Investigate Anomalies:
- Drill down into anomalies to understand their causes. In other words, this could involve looking at the specific details of an outlier to identify the root cause.
4. Derive Actionable Insights
Why Derive Insights?
Transforming data into actionable insights enables you to make informed decisions that drive business success.
Steps
- Form Hypotheses:
- Based on your data, form hypotheses about what might be influencing trends or anomalies. For example, a hypothesis could be that increased marketing spend leads to higher sales.
- Plan Actions:
- Develop action plans to address issues or capitalize on opportunities. For example, increase marketing efforts in channels showing the highest ROI.
- Monitor Impact:
- After implementing changes, monitor your KPIs to see if the expected improvements materialize.
5. Use Data to Inform Decisions
Why Use Data for Decisions?
Making data-driven decisions ensures that your strategies are based on evidence rather than intuition, leading to better outcomes.
Steps
- Regular Review:
- Schedule regular reviews of your dashboards and reports to stay up-to-date with your business performance.
- Strategic Decisions:
- Use insights from your data to guide strategic decisions. For example, use sales data to determine which products to promote or discontinue.
Final Thoughts
Data tracking in HubSpot CRM equips you with a powerful compass, guiding you towards customer connections and business growth.
So, you’ve learned the essential steps: setting up tracking, building insightful reports, and uncovering valuable trends.
Now, it’s time to leverage this knowledge and steer your business towards success.
HubSpot CRM empowers you to harness the power of data, but making it truly shine requires expert guidance.
That’s where MakeWebBetter comes in. That is to say, our team of HubSpot specialists can help you:
- Streamline your data tracking setup: Ensure you capture the most valuable customer interactions for insightful analysis.
- Craft custom reports and dashboards: Gain a clear view of your data, presented in a way that informs strategic decision-making.
- Develop data-driven marketing campaigns: Target the right audience with the right message at the right time.
So, ready to unlock the full potential of data-driven marketing and sales in HubSpot CRM?
Contact MakeWebBetter today and let’s chart your course to success together!
Want to Improve Your HubSpot Experience?
Schedule a quick call with MakeWebBetter today!