

Data is precious and will last longer than the systems themselves.
We’ll discuss the data you must analyze in 2023 if you’re running an eCommerce website.
Besides, you’ll know about eCommerce metrics. And why should you really care about them?
eCommerce metrics are the data that show your eCommerce website analytics performance. By analyzing your eCommerce metrics, you ensure your website does well throughout the year. Not just the holiday season!
Let’s get started.
Table of Content
- What is eCommerce tracking?
- How does eCommerce tracking work in Google Analytics?
- Key eCommerce metrics on Google Analytics
- Setting up eCommerce tracking in Google Analytics
- Updates in GA4 for eCommerce website analytics
- Getting started with GA 4 to track website analytics metrics
- Useful GA integration for eCommerce tracking
- Benefits of eCommerce tracking & eCommerce website analytics
- Tips for troubleshooting GA 4 common issues
- Conclusion
Role of Google Analytics eCommerce tracking
Let’s say you own a physical clothing store. Now it’s easy to track the customers you’re encountering and know them in person. Some might even tell you about their references and how they ended up in your store!
However, what would you know about the random visitors entering your eCommerce website? How they interacted with it? How did they finally make a purchase from your store?
All these questions have a single-word answer in the form of an eCommerce metric. 74% of eCommerce businesses believe that Google Analytics is important or very important for their business.
Let’s check the basic things first.
What Is eCommerce Tracking?
eCommerce tracking is a method of measuring and analyzing customers’ behavior on an eCommerce website. It involves tracking and analyzing data related to user behavior and transactions on the website.
For instance, the number of visitors, the products they view, add to cart, purchase, and the revenue generated from these transactions. All of them are eCommerce success metrics.
eCommerce tracking typically involves the use of tools like Google Analytics or Adobe Analytics to track and analyze data related to user behavior on the website.
Data from these tools are used to optimize the website’s design, functionality, and marketing strategies to increase sales, revenue, and customer satisfaction.
How eCommerce Works In Google Analytics?
In Google Analytics, eCommerce tracking allows you to track and analyze customers’ behavior on an eCommerce website. Google Analytics is used by over 84% of eCommerce websites worldwide.
- To use eCommerce tracking in Google Analytics, you first need to set up an eCommerce tracking code on your website.
- This code tracks data related to user behavior and transactions on your site, such as the products they view, add to the cart, and purchase.
Once the tracking code is set up, you can access various eCommerce reports in Google Analytics, including
- The Sales Performance Report for tracking total revenue, average order value, and the number of transactions.
- The Product Performance Report to see what products perform better than the rest. It includes data on product views, add-to-cart actions, and purchase conversions.
- The Shopping Behavior Report offers insight into your customers’ shopping behavior. Such as the number of sessions that included product views, how many sessions included add-to-cart actions, and how many ultimately resulted in purchases.
- The Checkout Behavior Report tracks customers’ behavior during the checkout process. For instance, the number of sessions that reached the checkout page and how many resulted in completed transactions.
- The Marketing Report provides insights into your marketing performance, including data on traffic sources, marketing campaigns, and revenue generated from different channels.
Key eCommerce metrics to track on Google Analytics
There are several tools out there you can use to track your website’s analytics data. But the most prominent and free tool is obviously Google Analytics.
So I’ll list some top Google analytics metrics you must track in 2023 to scale up and grow your eCommerce website.
Website analytics metrics to track on Google Analytics
|
1. Channels
Channels show how visitors reach your website. Tracking this metric can help you identify what sources users are using to reach your website. Channels that drive the highest and lowest traffic to your site.
Go to Acquisition > All Traffic and click on Channels. Some key eCommerce metrics you should pay attention to are mentioned below.
a. eCommerce Conversions
This is an important eCommerce KPI. eCommerce conversion rate tells how many users have bought your products. For example, if
- 1000 users visited your website and 10 bought a product; your eCommerce conversion rate is 1000/10= 1%.
Getting a high eCommerce conversion is quite tough. However, if you’re getting an eCommerce conversion rate between 1 to 2%, that’s fine. Above 2% is a bonus.
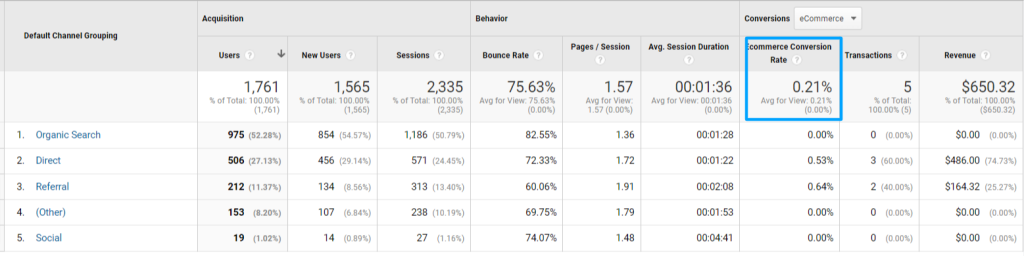
You’re going great if your eCommerce conversion rate is above 2%. If it’s less than 1%, track where you’re lacking.
b. New Users
New users are those who visited your website or a product page for the first time. If you’re getting a high number of new users, this means your content is reaching more and more audiences.
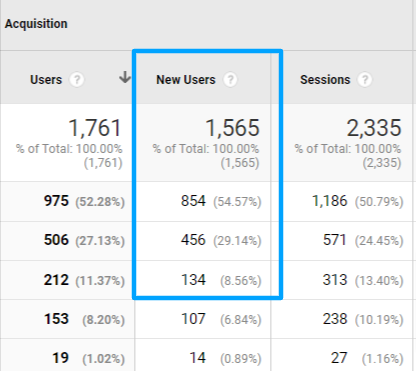
However, you should also look that if most users are new to your pages, it can indicate that they are not returning to your pages.
c. Average Order Value
Average Order Value (AOV) is a metric in Google Analytics that represents the average dollar amount a customer spends in a single transaction on your website.
To calculate the AOV in Google Analytics, the total revenue generated by all transactions during a selected period is divided by the total number of orders placed during that period.
For example, if your website generated $10,000 in revenue from 100 orders monthly, the AOV would be $100.
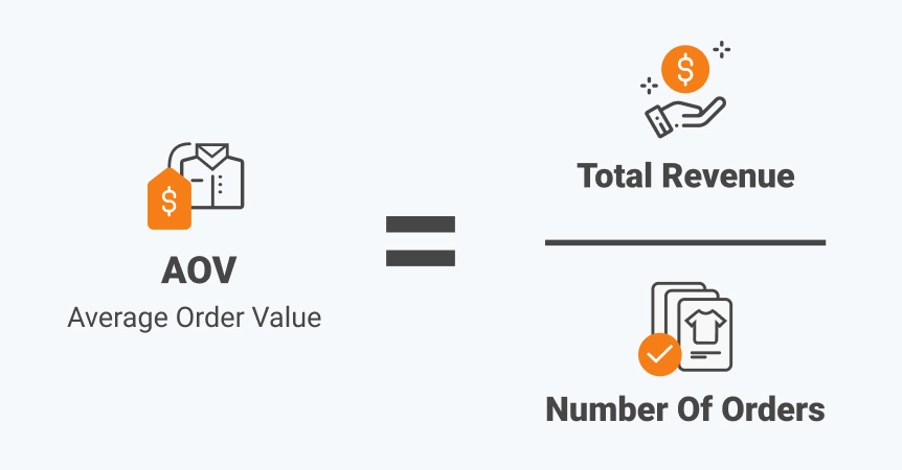
Source: AlidropShip
The AOV metric is important because it helps eCommerce businesses understand how much, on average, their customers are spending per order.
By monitoring AOV, businesses can identify trends and make informed decisions about pricing, promotions, and product offerings to optimize revenue.
For example, if your AOV is low, you may
- consider implementing upselling or cross-selling techniques to encourage customers to purchase additional products.
On the other hand, if your AOV is high, you may
- want to consider offering discounts on bundled products or free shipping to encourage customers to purchase more frequently.
2. Product Revenue
The eCommerce metric of Product Revenue represents the complete earnings obtained from sales of individual products within a specified time frame.
You can access the Product Performance report under Conversions > Ecommerce to view a list of products arranged by their respective Product Revenue, along with the percentage of the contribution made by each product to the overall revenue.
![]()
With Enhanced eCommerce enabled, you can also view the revenue generated by each product category
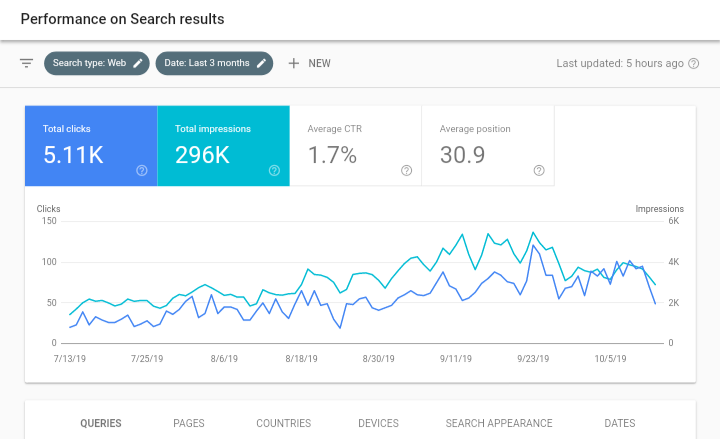
3. Search Console
In the search console tab, you get plenty of meaningful eCommerce metrics that tell you a lot about your website.
Navigate to Acquisition > Search Console, then track some of the following eCommerce key metrics.
a. Countries
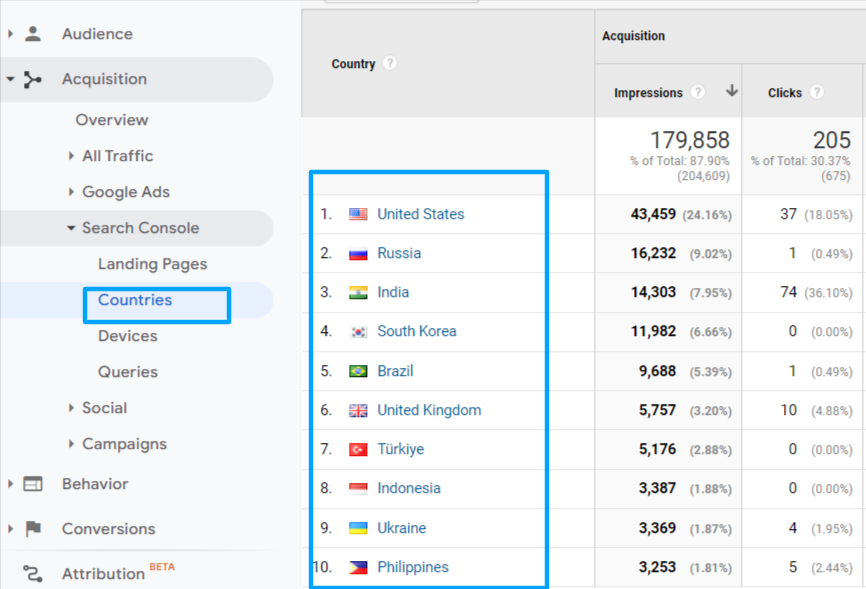
In this dimension, you can see which countries drive the most traffic to your website. This can be helpful for your ad campaigns since you can target those countries with more personalized ads.
b. Devices
This section shows website traffic from desktops, mobiles, and tablets. You can check your position, sessions, revenue, CTR, etc.; you’re getting from these devices.
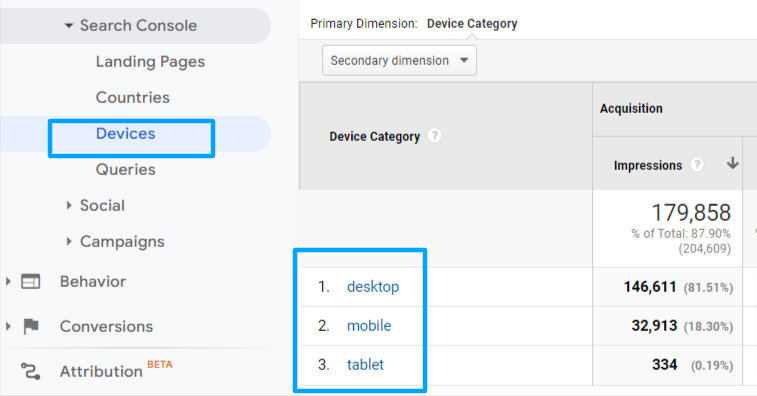
It is important to know about the devices your eCommerce website is being navigated from because it can help you optimize the user experience for your customers and improve the performance of your website.
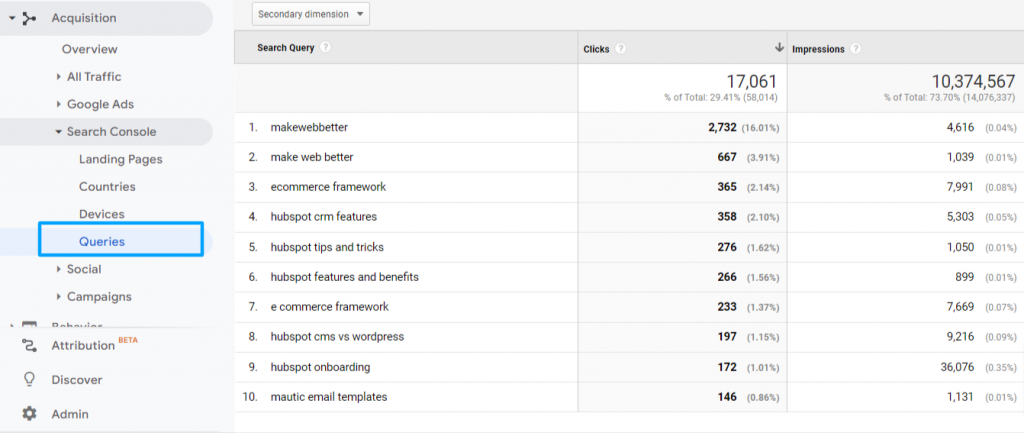
c. Queries
Queries shows the list of the search queries users enter on Google to find your website. You can view the position, CTR, etc., for specific queries in this section.
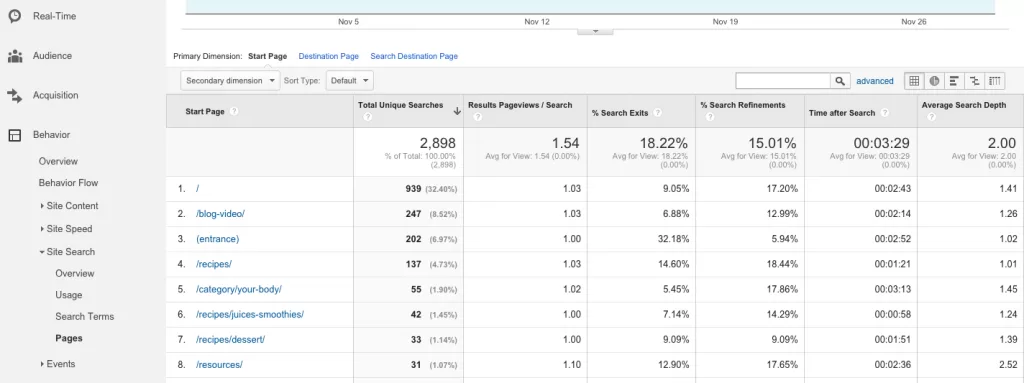
d. Site Search
Site search is a great eCommerce metric to track what your audience is searching for on your website. In other words, it shows the terms or pages users are searching within your website.
Go to Behavior > Site Search and track these valuable eCommerce Google analytics metrics.
e. Search Terms
It displays the list of the terms users search on your website. This tells what things most users look for on your site.
f. Search Pages
Search pages show you the pages users search within your website. If they’re searching for a specific page a lot, it means they’re finding the most value on that page.
5. Landing Pages
This is a crucial eCommerce metric for your website that tells about the activities on the page the visitor lands for the first time.
Say if a visitor searches a query, gets MakeWebBetter’s Contact Us page in the results, and clicks on the page’s link, 1 session will be added to the Contact Us Page.
You can find Landing Pages by navigating toward Behavior > Site Content and Acquisition > Search Console.
Some more KPI metrics for eCommerce in the landing page tab are as follows.
a. Click-Through Rates
Click-through rate shows how many times users clicked on your specific page. CTR is calculated by Clicks/Impressions multiplied by 100. Impressions and Clicks are also shown besides CTR.
If a page on your website has 1000 impressions and 50 clicks, your click-through rate is 50/1000 * 100 = 5%. We can’t provide a specific number for a good CTR.
It depends on many factors. But analyzing this eCommerce metric will give you the idea that your CTR is high or low.
b. Bounce Rate
Bounce rate shows the percentage of users who left your site after visiting just one single page. It differs as per the page type, but we can say that below 50% is considered a good bounce rate. And above 70 is bad, and between 50 to 70% can be average.
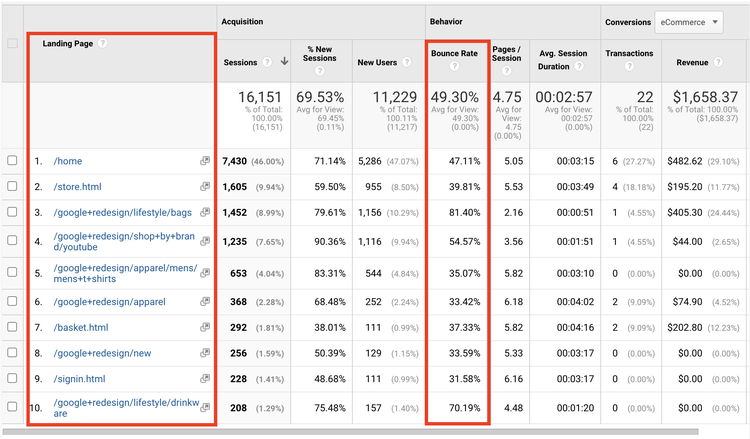
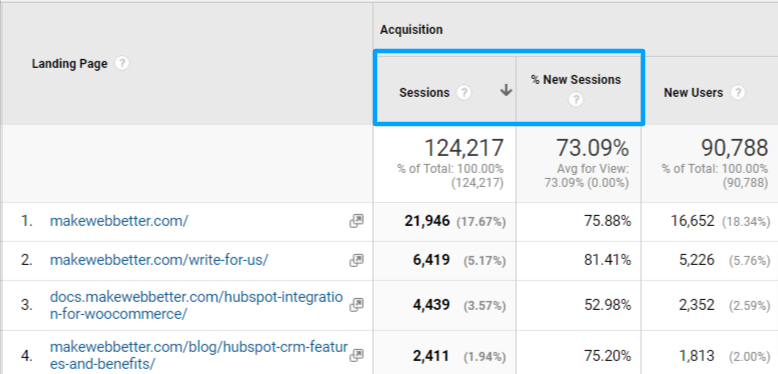
c. Session & New Session
Sessions show the period of time a user was engaged on your site. This can be a key metric for your eCommerce business to understand whether your pages can keep users engaged on it.
Like sessions, new sessions show the engagement that happened for the first time on your site.
Landing pages can also help you check the performance of your content. Here’s a secret trick you can use to track content performance with Google Analytics. Using it will definitely help you improve your content.
6. eCommerce
If we’re talking about eCommerce metrics, we cannot neglect the eCommerce tab in Google Analytics. Go to Conversions > Ecommerce to check some of these key eCommerce metrics mentioned below:
a. Product Performance
Product performance shows your products’ performance. You can track the revenue generated by every product on your website, unique purchases, quantity, and more in this dimension.
You can use this data to determine what products aren’t performing well and try tactics to increase sales.
b. Checkout Behavior
You can consider it a checkout funnel where you can track how the audience behaves in your funnel.
You get the data about the sessions, percentage of users who moved forward in your funnel, abandonments, etc. This can show how many users have completed the purchase. Number of users who filled out the checkout form or users who viewed your products.
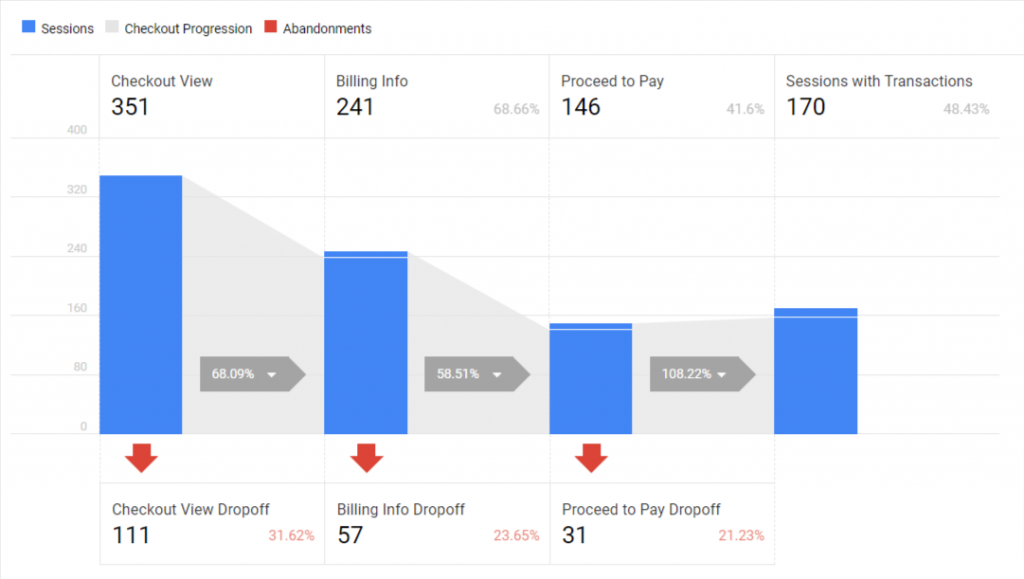
You can also add more steps to your funnel if needed.
c. Shopping Behavior
Like checkout behavior, shopping behavior shows how your customers shop at your website.
If you find it hard to understand the funnel, scroll down to see the numeric figures.
At the bottom of the checkout behavior or shopping behavior section, you can see the Sessions, cart addition, transactions, completion rate, etc., made by new and returning visitors. Something like this
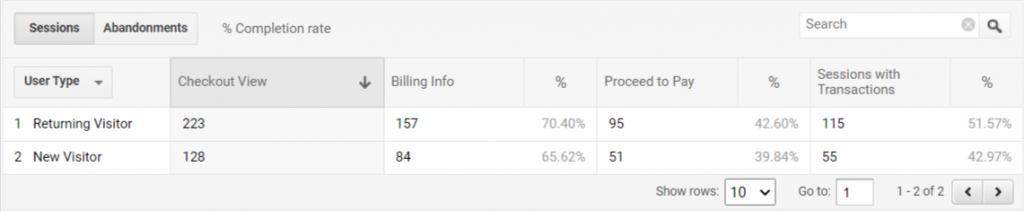
You can filter this data too and analyze it deeply by clicking on the User Type drop-down above New Visitor.
d. Cart Abandonment Rate
Cart abandonment rate is a common metric eCommerce business use to measure the percentage of users who add products to their shopping cart but leave the website without completing the purchase.
Google Analytics provides an easy way to track cart abandonment rates through its eCommerce tracking feature.
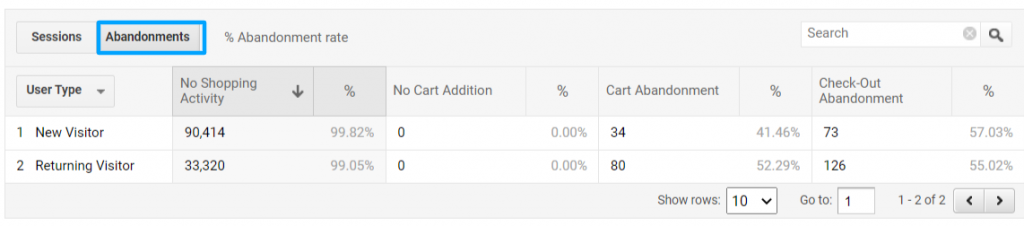
In the Shopping Behavior report, you can view the Cart Abandonment Rate, which is the percentage of users who added items to their cart but did not complete the checkout process. This metric can help you identify areas of your website or checkout process that may need improvement to reduce cart abandonment.
7. Events
Events tracking can help track whether the audience interacts with your content. If you want to track events, add a few codes to your website. Google shows how to set up event measurement; you can check it out.
Go to Behavior > Events and track some of these significant analytics metrics for eCommerce in Google Analytics.
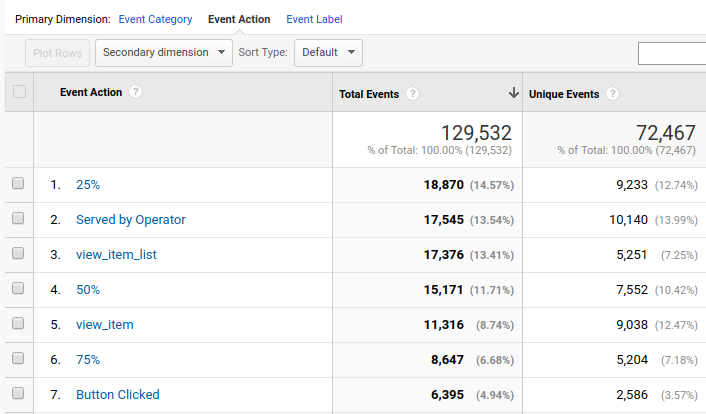
a. Top Events
This section lets you track the top events. If you want to track the number of times users click on Subscribe Button or View Cart button or scroll 50% on your page, you can track it here.
Try to use the Event Action, Event Label dimensions too. This can give you more precise data.
b. Pages
Here, you can track the events that occurred on specific pages. This can help you track which pages users interact most or least.
c. Event Flow
This looks like a labyrinth but can be extremely helpful for you to track the flow of the events. You can track how the users have triggered the events you’ve set on your website.
8. Audience
The Audience section of Google Analytics provides detailed insights into your website visitors’ demographic, geographic, and behavioral data.
It is divided into several sub-sections that allow you to analyze various aspects of your website visitors. These eCommerce metrics include
a. Overview
Provides a high-level summary of your website visitors’ demographic, geographic, and behavioral data.
b. Demographics
This shows the age and gender breakdown of your website visitors. Geo provides information on the location of your website visitors, including country, city, and language.
c. Behavior
Analyze how often users visit your website, how long they stay on it, and how many pages they visit.
d. Technology
This shows the devices and browsers users use to access your website.
e. Mobile
Provides information on the mobile devices and operating systems your website visitors use.
f. Custom
Allows you to create custom segments based on specific criteria, such as users who have made a purchase or users who have visited a particular page on your website.
Analyzing audience data in Google Analytics can help you better understand your website visitors’ behavior and preferences. This information can then be used to improve your website content, user experience, and marketing campaigns to drive more traffic and increase conversions.
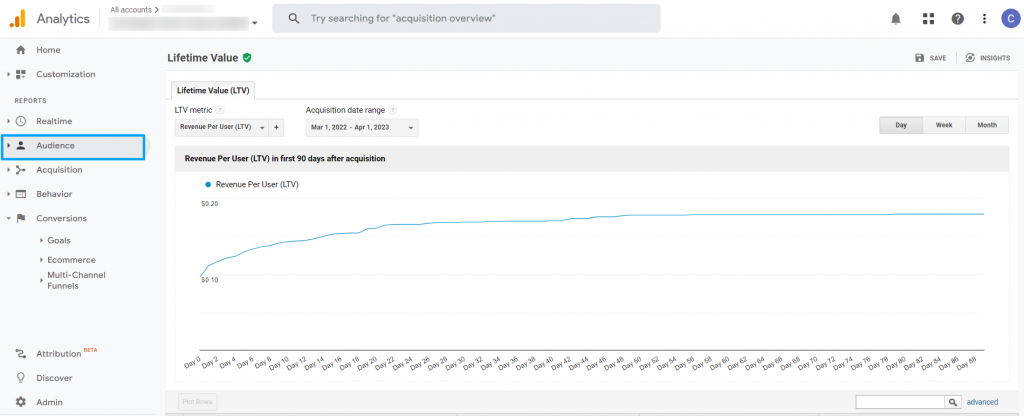
g. Customer Lifetime Value
Customer lifetime value (CLV) is an eCommerce metric that estimates the total value of a customer to your business over the entire time that they are a customer.
Google Analytics does not provide a direct way to view customer lifetime value, but you can calculate it using eCommerce data and a few calculations.
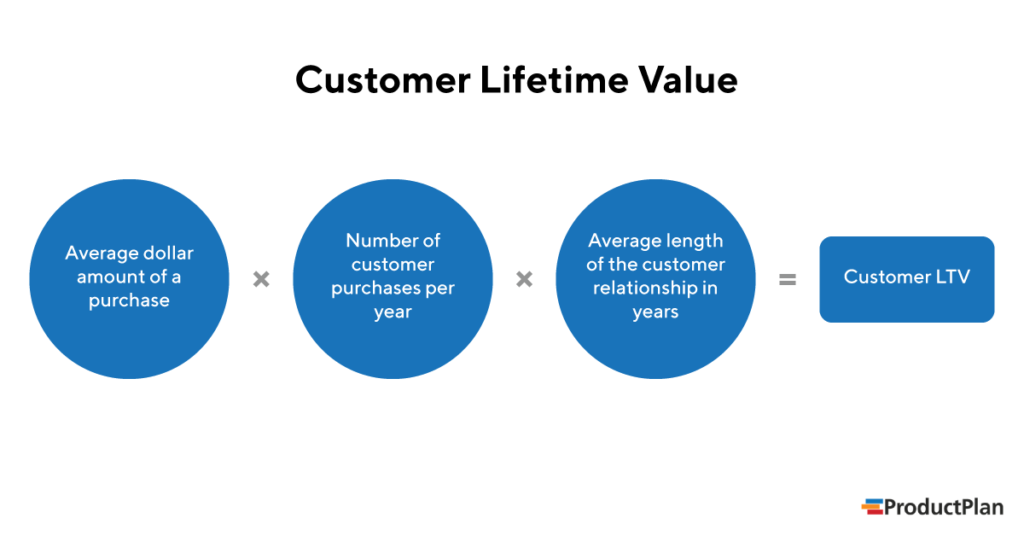
- Calculate the average order value
- Calculate the purchase frequency. To do this, you can use the following formula: Purchase Frequency = Total Number of Orders / Total Number of Unique Customers.
- Calculate the customer value. Multiply the average order value by the purchase frequency.
- Estimate customer lifetime spam.
- Multiply the customer value by the estimated customer lifespan.
9. Exit Pages
This is an eCommerce website metric I always keep track of. It shows the users are exiting your website from a specific page. Many people confuse exit pages with bounce rates.
The bounce rate shows the percentage of users who exited your site after visiting one page. The exit page displays how many times a user exited your website from a specific page after browsing through several pages.
Go to Behavior > Site Content and click on exit pages. You’ll get the list of the pages with the number of exits. You can sort this list to check what pages are getting fewer exits.
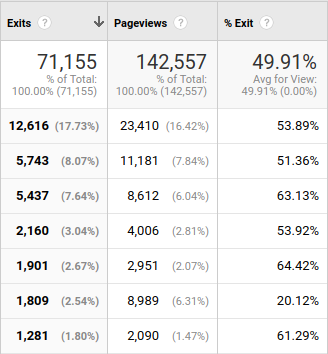
You can also check the exit percentage in the All Pages section under Behavior in the Site Content dimension.
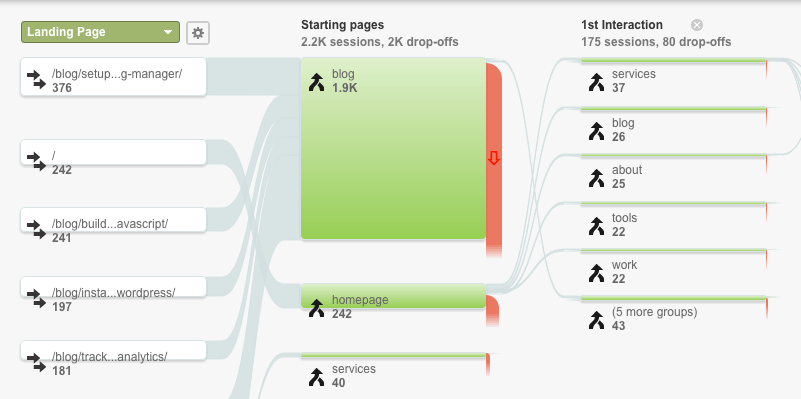
10. Behavior Flow
Similar to Event Flow, behavior flow helps you track the users’ journey on your website. It shows you what pages they landed on and where they exited your site from.
Analyzing behavior flow can help you identify the user behavior and obstacles (or pages) that are taking users away from your website
11. Source/Medium
Source/ Medium tells where and how the users are coming to your site. Like Channels, you can check for the eCommerce conversion rate and new users in this tab to get an idea about the most converting traffic sources.
Navigate to Acquisition > All Traffic and click on Source/ Medium to track metrics under this dimension. Also, use primary and secondary dimensions to get deep insights into your website’s traffic.
That’ll make it easy for you to build strategies to boost organic traffic, increase referral traffic and understand your users’ behavior on different pages.
a. Referral Sources
Referral sources in Google Analytics are the websites or online platforms that send traffic to your website. Understanding referral sources is important for identifying where your website traffic is coming from and which marketing efforts are driving the most traffic.
It is also one of the prime eCommerce KPI metrics.
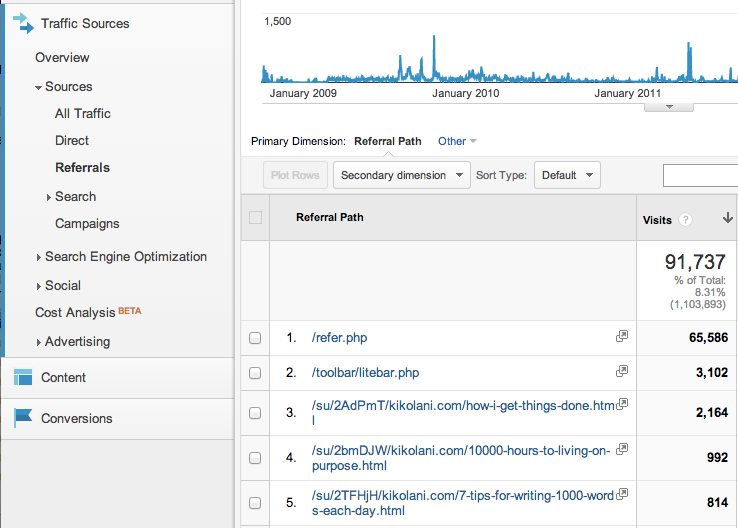
Go to Acquisition >All Traffic > Referrals
Once you are in the “Referrals” section, you can view the list of websites or online platforms that have sent traffic to your website. You can also view the number of sessions, bounce rate, and other engagement metrics for each referral source.
Those were the best eCommerce metrics that can help you make smart decisions and set up KPIs that actually slap!
Also, now is the perfect time to tell you about setting up GA for your business.
How To Set Up eCommerce Tracking In Google Analytics?
Tracking eCommerce performance metrics brings you closer to your audience and goals. If you’re ready for both, let’s figure out how to set up Google Analytics for your business to measure these best eCommerce metrics.
To set up Google Analytics for an eCommerce store, follow these steps:
- Sign in to your Google Analytics account and navigate to the “Admin” section.
- Under the “Account” column, select the account you want to set up eCommerce tracking.
- Under the “Property” column, select the property for which you want to enable eCommerce tracking.
- Click “Ecommerce Settings” under the “View” column.
- Toggle the “Enable Ecommerce” button to “On“.
- Toggle the “Enable Enhanced Ecommerce Reporting” button to “On” if you want to use advanced eCommerce reporting features.
- Set up your eCommerce tracking code on your website. This may be done automatically if you’re using a platform like Shopify or WooCommerce. If not, add the tracking code to your website’s header or footer.
- Set up your eCommerce goals. Goals are specific actions you want users to take on your website, such as purchasing or signing up for a newsletter. You can set up eCommerce goals under the “Goals” section of your Google Analytics account.
- Test your eCommerce tracking by making a purchase or completing a goal on your website. Check that the data is being recorded correctly in your Google Analytics account.
Once you’ve set up eCommerce tracking in Google Analytics, you can view important eCommerce metrics such as revenue, conversion rate, and average order value that we’ve just discussed above.
Book Free eCommerce Consultation
Are you ready to make data-driven decisions to improve your eCommerce store and drive more sales?
Google Analytics was launched back in 2005. Since then, Google has made many updates in its effort to make it seamless for eCommerce owners. All to track the key eCommerce metrics.
Google Analytics 4 is the latest addition to this legacy. Let me introduce you to the updates.
When?
Beginning July 1, 2023, Google Analytics 4 (GA4) will become the sole
option for Google Analytics users, replacing Universal Analytics
(UA or GA3). While some are enthusiastic about this change, others
are expressing concerns about the discontinuation of UA. Regardless
of their sentiments, it will be a significant transformation for all
users.
Updates: What’s New In GA 4?
Google Analytics 4 (GA4) will introduce several new eCommerce metrics and features that can be useful for eCommerce users. Designed for the future of measurement, GA4 is a novel type of property that:
- Gathers data from both websites and applications to enhance comprehension of the customer journey
- Utilizes event-based data instead of session-based data
- Encompasses privacy controls such as cookieless measurement and behavioral and conversion modeling
- Offers predictive capabilities to provide guidance without the need for complex models
- Facilitates direct integrations with media platforms to boost user engagement on your website or application.
Here are some examples of its features & usability:
1. Enhanced eCommerce tracking
GA4 offers a more detailed view of customer behavior with enhanced eCommerce tracking. This includes metrics such as product views, clicks, add-to-carts, checkouts, and more detailed product and transaction information.
2. Purchase Probability
GA4’s Purchase Probability feature uses machine learning to predict the likelihood of a user purchasing based on their behavior on your site. This can help you identify high-value customers and optimize your marketing campaigns accordingly.
3. Cart and Product Analysis
GA4 offers more granular insights into the cart and product behavior, including metrics such as cart abandonment rate and product detail views.
4. User-Centric Reporting
GA4’s user-centric reporting allows you to track customer behavior across multiple devices and platforms, giving you a more comprehensive view of the customer journey.
5. Custom metrics
GA4 allows you to create custom metrics based on your specific eCommerce goals, such as lifetime customer value or revenue per user.
GA4 offers more advanced eCommerce tracking capabilities and customer insights, making it a valuable tool for eCommerce businesses looking to optimize their online sales.
How to get started with Google Analytics 4?
To get started with Google Analytics 4 as an editor or administrator, you have three options:
Option 1:
Set up Analytics data collection for the first time if you’re new to Analytics and want to gather data for your website and/or app.
Option 2:
Add Google Analytics 4 to a site with Universal Analytics (Analytics “classic”).
The GA4 Setup Assistant will integrate a Google Analytics 4 property alongside your existing Universal Analytics property. Both properties can be accessed using the property selector in the Admin area, and Universal Analytics will continue to collect data.
Option 3:
Add Google Analytics 4 to a website builder platform or CMS (content management system) if you use no-code tools or a CMS-hosted website such as Wix, WordPress, Drupal, Squarespace, GoDaddy, WooCommerce, Shopify, Magento, Awesome Motive, HubSpot, or other platforms.
In this way, you’ll be ready to perfect your eCommerce website analytics.
Now if there’s anything I haven’t covered, it shall be the benefits of eCommerce tracking. Let’s quickly know why you should even care to track these eCommerce KPIs.
Some Popular Google Analytics Integrations for eCommerce & How They Can Help?
Google Analytics can be integrated with several tools to make tracking top eCommerce metrics more efficient. Here are some popular integrations you should know and leverage:
1. Google Tag Manager
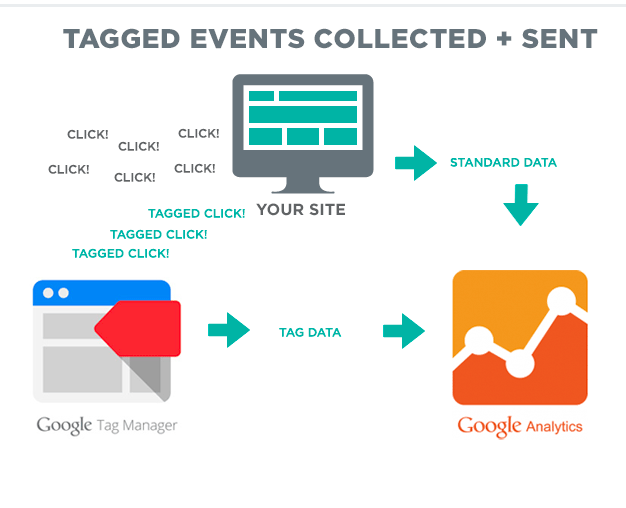
It is a free tool that allows you to add and manage marketing and tracking tags on your website without editing the code. You can use Google Tag Manager to easily set up and manage Google Analytics tracking for your eCommerce store.
2. Google Ads
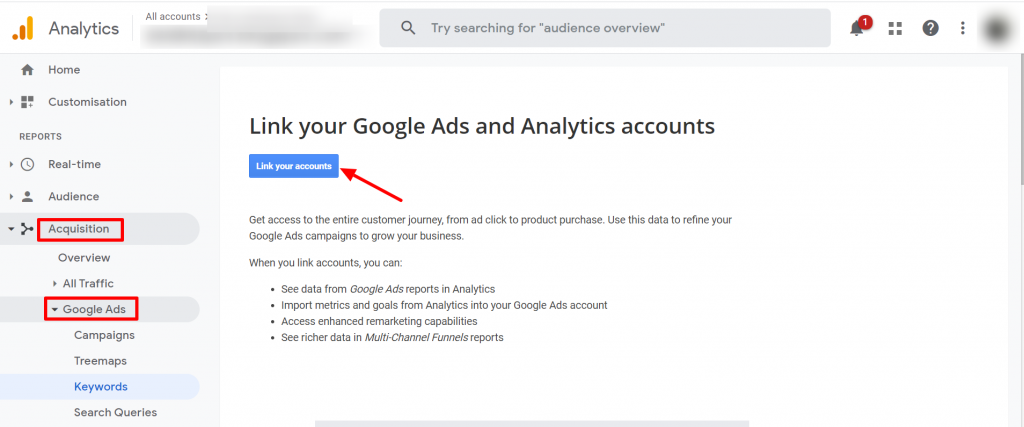
You can link your Google Ads account with Google Analytics to get a complete view of your ad performance and customer behavior.
Additionally, it allows you to see which campaigns and keywords drive the most revenue and which are not performing well.
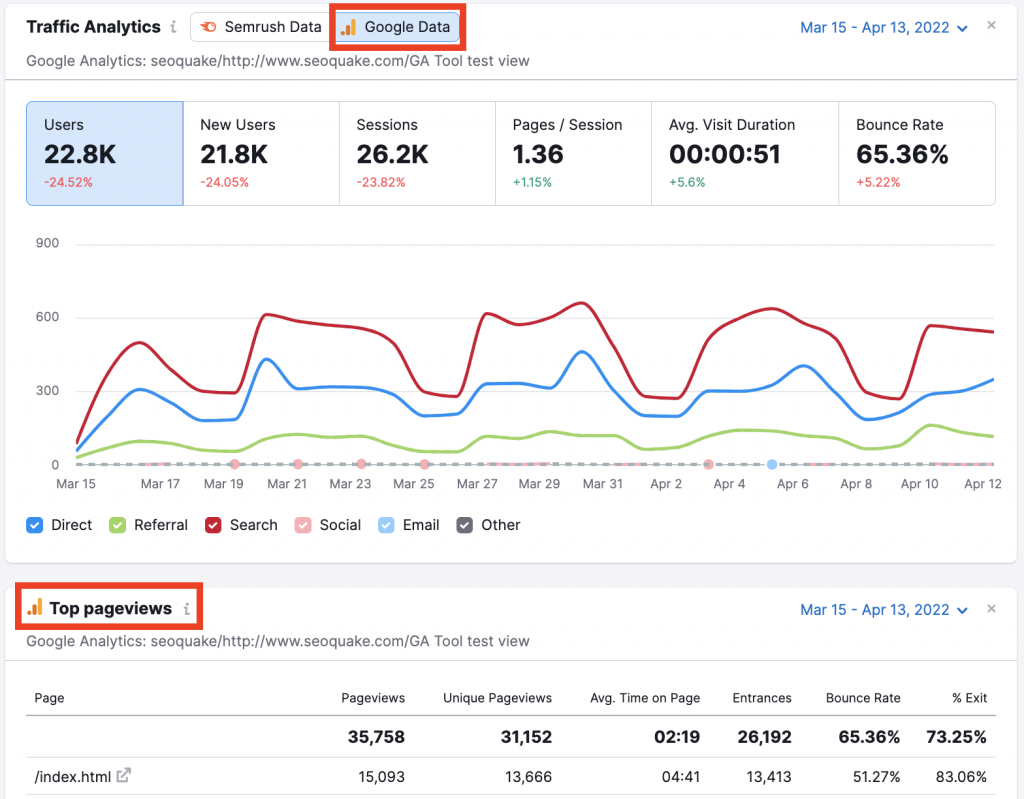
SEMrush
The SEMrush-Google Analytics integration allows you to view SEMrush data within Google Analytics, including information about organic and paid search traffic, keyword rankings, backlinks, and more.
Moreover, it can provide valuable insights into your eCommerce store’s SEO performance and help you identify opportunities to improve your search engine rankings and drive more traffic to your website.
For example, by integrating SEMrush with Google Analytics, you can:
- Firstly, view your top organic and paid search queries and see which one’s drive the most traffic and revenue to your eCommerce store.
- Secondly, analyze your backlink profile and see which websites are linking to your store and the quality and relevance of those links.
- Thirdly, monitor your eCommerce store’s keyword rankings and track changes over time, allowing you to adjust your SEO strategy accordingly.
4. Google Optimize
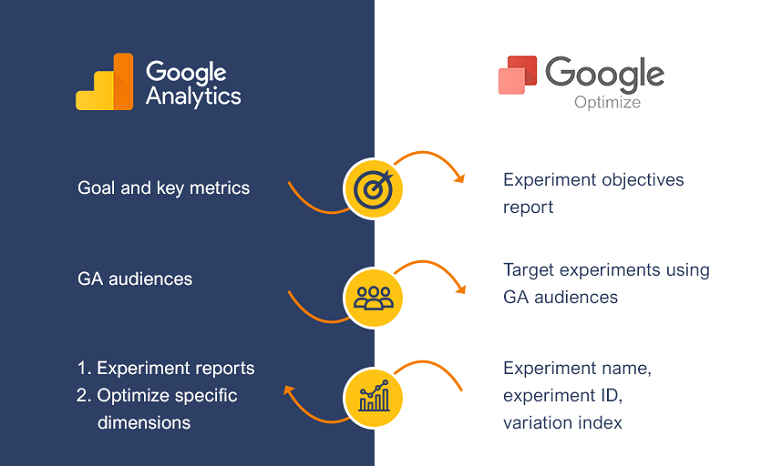
A free tool that allows you to create and test website variations to improve user experience and conversion rates.
Above all, by integrating Google Optimize with Google Analytics, you can track the performance of your website variations and see how they affect your eCommerce metrics.
5. Facebook Ads
Integrating Facebook Ads with Google Analytics allows you to track your eCommerce store’s social media performance, including ad clicks, conversions, and revenue generated from Facebook campaigns.
6. Google Search Console
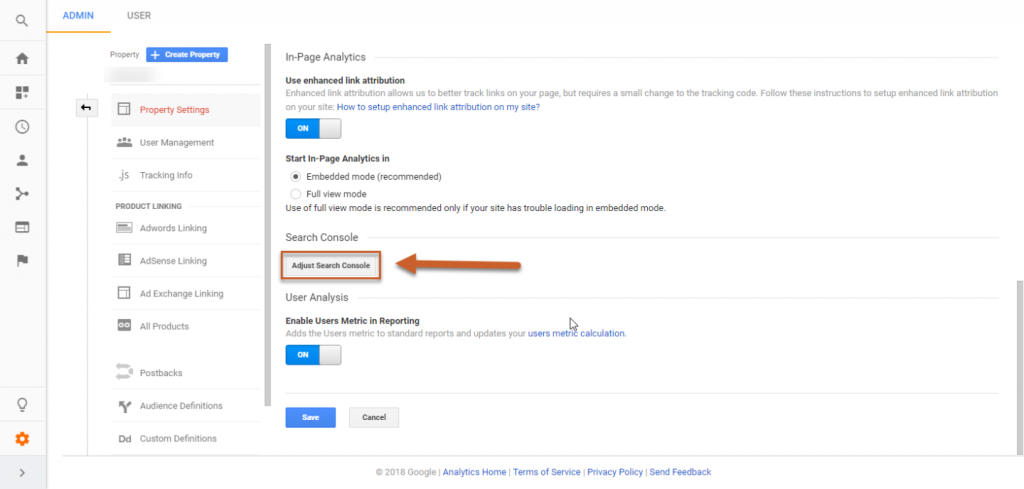
Another free tool that provides insights into your website’s appearance in Google search results. By linking your Google Search Console account with Google Analytics, you can see which search queries are driving traffic to your eCommerce store and how users are interacting with your website.
What Are the Benefits Of eCommerce Tracking?
Tracking eCommerce KPI metrics can offer numerous benefits to businesses, including
1. Identifying top-selling products
Top eCommerce metrics can help you determine which products sell the most and generate the most revenue.
Additionally, by identifying top-performing products, you can optimize your inventory and marketing strategies to increase revenue and profit margins.
2. Understanding customer behavior
Tracking eCommerce google analytics metrics allows you to understand better how customers are interacting with your website or app.
That is to say, this data can provide insights into customer preferences, behavior, and expectations, enabling you to tailor your marketing and sales strategies accordingly.
3. Optimizing the conversion process
eCommerce KPI metrics can help you identify bottlenecks in the conversion process, such as shopping cart abandonment, and take steps to improve the user experience and increase conversion rates.
By optimizing the conversion process, you can increase revenue and customer satisfaction.
4. Evaluating marketing campaigns
By tracking the most important Google Analytics metrics, you can evaluate your marketing campaign’s effectiveness and identify improvement areas.
This data can help you allocate your marketing budget more effectively and optimize your campaigns for better results.
5. Calculating the customer lifetime value
eCommerce KPI metrics can help you calculate customer lifetime value, which is the total value of a customer to your business over their entire customer journey.
This data can help you make strategic decisions about customer acquisition, retention, and marketing and sales strategies.
Tips For Troubleshooting Common Issues In GA Or Discrepancies In Data
In case you ever come across an issue in Google Analytics, you can contact us. However, here are a few things you might examine yourself if you’re facing issues with eCommerce website analytics metrics:
- Check data freshness and time zone settings
- Verify that the tracking code is installed correctly
- Check for duplicate tracking codes
- Check for filters that might be blocking or modifying data
- Verify that goals and events are set up correctly
- Check for data sampling
- Verify that cross–domain tracking is set up correctly
- Check for referral spam and exclude known spam domains
- Verify that eCommerce tracking is set up correctly
- Check for discrepancies between Google Analytics and other data sources, such as server logs or CRM systems, or popular integrations.
Conclusion
In conclusion, Google Analytics provides a wealth of metrics that eCommerce businesses can use to track their performance and optimize their online stores.
By tracking key website analytics metrics such as conversion rate, cart abandonment rate, and customer lifetime value, eCommerce businesses can gain valuable insights into their customers’ behavior and make data-driven decisions to improve their online shopping experience.
With the launch of Google Analytics 4, eCommerce businesses can now access even more advanced features, including machine learning-powered insights and cross-platform website analytics metrics tracking capabilities.
Moreover, by leveraging these powerful tools and integrations, eCommerce businesses can stay ahead of the competition and grow their online sales in today’s ever-evolving digital landscape.
Cross Your eCommerce Success Rate With MakeWebBetter
We’ve helped 10k plus customers to excel in their eCommerce businesses KPI. Get your skyrocket sales consultation now!


Reliable growth in online sales comes from analyzing performance over time in different parts of your business. Tracking the right metrics will help you improve conversion rates over time.
Yes. That is why tracking performance is critical. Thanks for reading the post Robert :)
Amazing article friend. Thank you so much for sharing these new and relevant insights with us. Google Analytics is playing a vital role in tracking our website traffic and has turned out to be an inevitable part of achieving our business goals. There are many good Google Analytics Consultants too who offer innovative services to businesses and organizations these days.
Thank you once again friend and keep on writing>
Thanks for reading. And yes Google Analytics is critical to get meaningful insights. This is why I keep an eye on it regularly and I’d recommend you to do the same. Thanks again :)