
")
Time plays one of the biggest roles nowadays, especially in the digital world where things are changing rapidly as you really need to be updated for the coming challenges in order to compete with your competitors. Therefore, your marketing performance management game needs to be on point!
For the large companies, it’s not a single man’s show, they need a proper team for that. Now it’s not only about you and your dedication. Rather about your team, their performance & dedication, because every person or employee in a team will not think in the same direction. There are different categories of employees. How will you judge them being a manager or founder of the company? If your employees are not “salespeople”, it can be hard to track their marketing performance management, especially for the managers or higher authority people not having enough time to analyze them separately. Measuring marketing performance management factors can help you know where your team stands.
Poor marketing performance management can have a significant negative impact on a company’s growth and credibility, which is why managers and owners need to take a proactive approach to control and measure employees’ actions and productivity. The exact process used to analyze employee performance will, of course, vary depending on the niche, but some universal rules can be applied in each industry.
Google Data Studio Report To Understand Your Marketing Team Performance
There are lots of different tools that can help you analyze your team’s marketing performance individually. I always go with Google Data Studio not only because it’s free, but the visualization in this is much better. Also, it is easy to create and understand.
I have created a report where you can easily understand your employee performance without spending your crucial time unnecessarily. In this report, I’ve used some important dimensions and matrices from google analytics.
For example- You have an eCommerce site and a team to handle it, now you need to check the marketing performance management of your teams individually considering the following:
SEO Team Performance – What is the performance of the user coming organically on-site, what about the conversion rate and their behavior?
Ads Team Performance – Performance of the user coming from the ads that can be Google ads, Facebook ads, etc. Are the users relevant? Is the ROI performance good or not, etc.
Social Media Team Performance – How much time are users spending on the site after arriving from social media platforms like Facebook, LinkedIn, Instagram, etc. It considers the impact on customer experience.
How To Start?
-
Create a Segment In Google Analytics
Before going through the Google Data Studio report, let’s create different segments. Create a Segment In Google Analytics (which will help in Google Data Studio Report).
If you are not familiar with the segments in Google Analytics, check out the article about segments.
In google analytics, you have to create 4 different segments. Let’s start with creating a segment of the visitors coming from social media.
STEPS
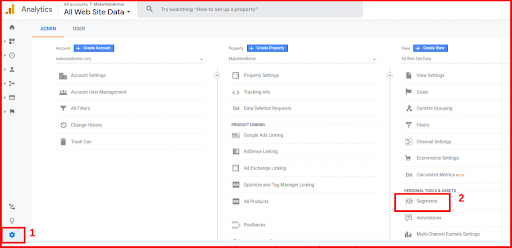
- In the Admin section, select “Segments”.
- Then select the new segment.
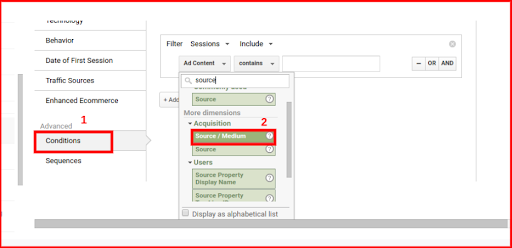
- From the advanced section, select “Condition”.
- Then select “Source And Medium”.
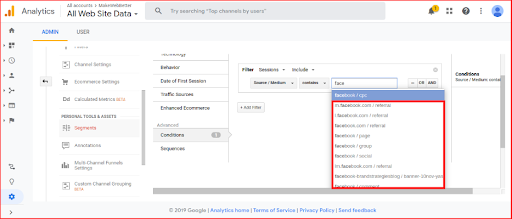
- Now you need to select all the sources and mediums from where you are receiving traffic coming through social platforms.
Note- You need to be sure not to select any other segment visitors, like in the image you can see there is a CPC medium also suggested which is part of social media traffic but, those visitors are coming from ads so this medium will be selected in ads segment.
Now we can move to Google Data Studio and let’s see how these segments are going to help in creating Google Data Studio Report.
Let’s Get Started With Google Data Studio (Template Overview)
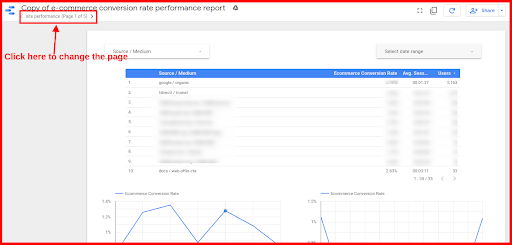
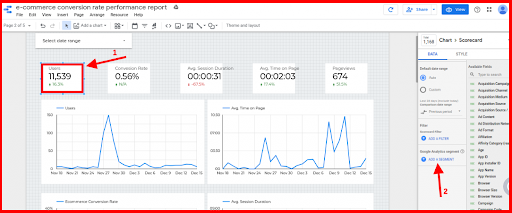
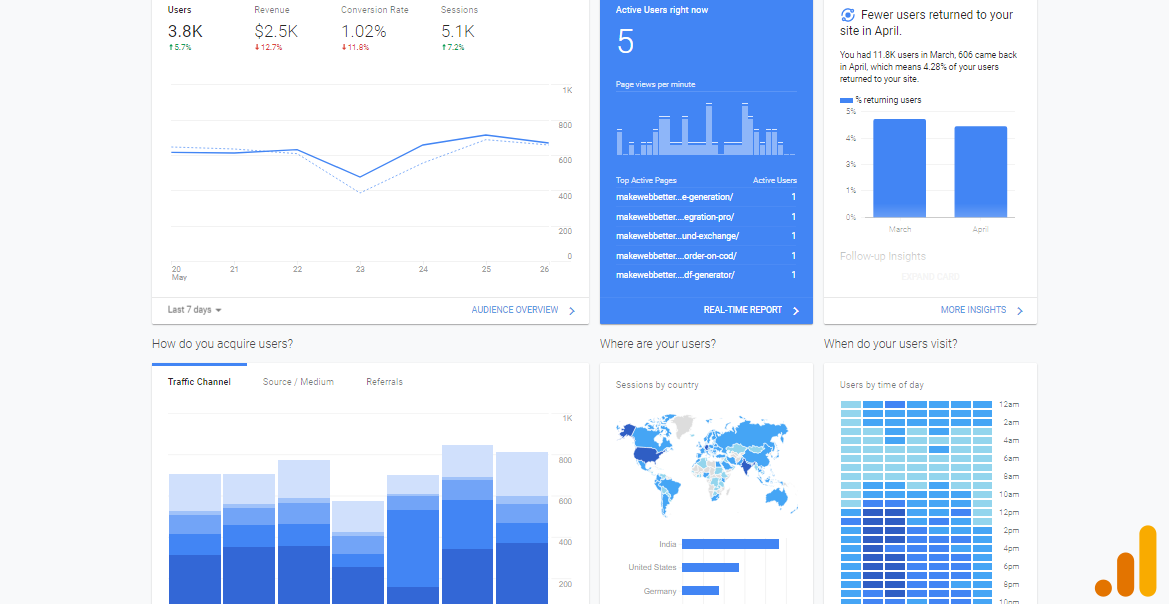
Here’s a screenshot of the Google Data Studio Report. At the top left corner, you can see there are a total of 5 pages. By clicking on that you can change the pages.
This is the first page of the report, there are 4 more pages where I displayed the report of Individual segments like-
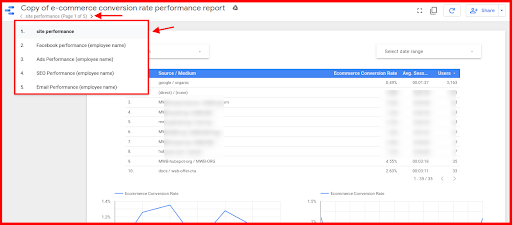
- Facebook Performance
- Ads Performance
- SEO Performance
- Email Performance etc.
These are the screenshots of the rest of the pages.
All the individual performance page’s structure is the same, here I used different segments to filter data.
The Site’s marketing performance management
While creating this Data Studio Report I can add lots of different charts and can display data. But, as this is for the people who don’t have time to analyze all the points, I decided to add only the dimensions and metrics which will explain each and everything to the respective people.
The first page is the summary of the whole site’s marketing performance management, I have started with the table where I have mentioned the source and medium including:
- From where the users are arriving.
- The source and medium provide a high conversion rate.
- How much time users are spending after Landing on the site?
Now let’s see what you can understand through this table.
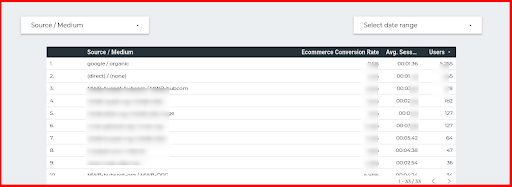
This table will help you understand the top source and medium through which:
- Users convert the most.
- How much time a user takes on average to convert.
- The number of visitors.
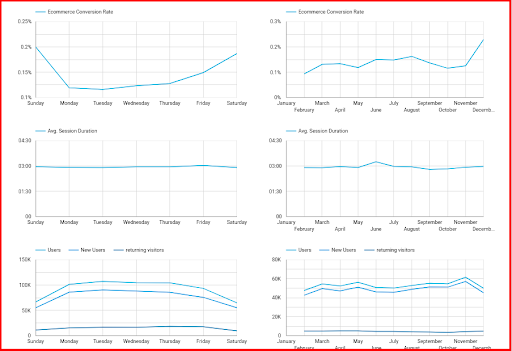
Next will be the time series chart with the same matrices, e-conversion rate, session duration, and users (new and returning). In this chart, you will be analyzing that:
Where are the ups and downs in the conversion rate, session duration, and visitors?
By combining e-commerce conversion rate with Avg. Session Duration and user charts you can understand what affects the most in the fluctuation of the conversion rate.
How can the combination of different matrices with conversion rates help?
There are different cases when the conversion rate increases or decreases, in some cases the conversion rate depends on the user acquisition or maybe the user behavior becomes the reason for the increase and/or decrease in the conversion rate. There are so many reasons but you need time for that and that is the reason why I selected only the important matrices. These points can be checked by filtering different source mediums.
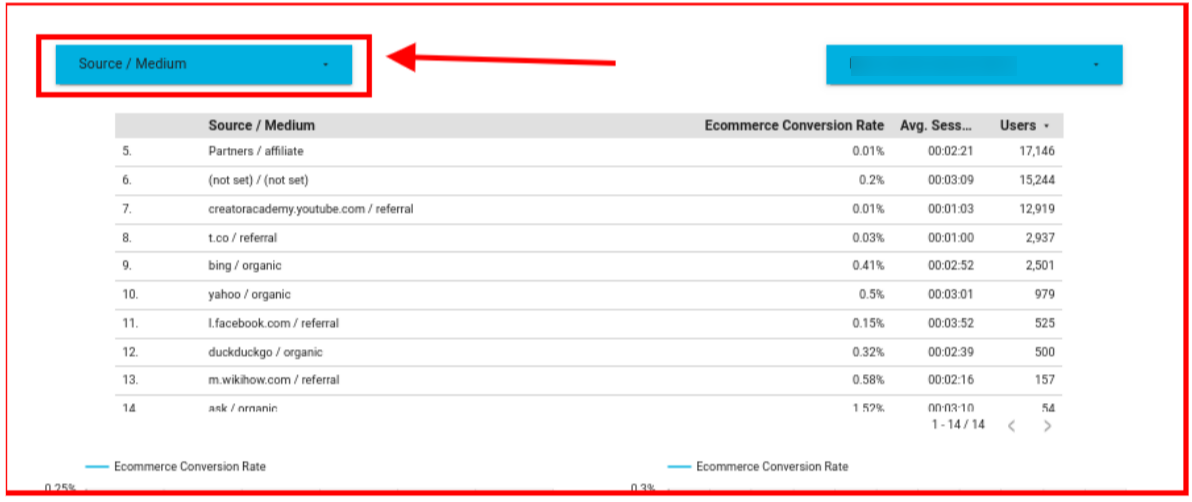
Here I have added a filter of source and medium and by clicking on that you can select an individual source and medium for analysis.
This is about the first page of this Data Studio Team Performance Report. If you feel that more points can be added to this page, please share your views in the comments.
Individual Team Performance
I started with the social media team performance report, this is the visitor’s performance arriving from social media. Remember in the starting we created a different segment in google analytics? Here we are using those segments.
Note – You have to log in with the same account through which you have created a segment in google analytics so that can be reflected in Google Data Studio.
STEPS
- Select any one chart and from the sidebar select “add a segment”.
- Select the social segment you created in google analytics
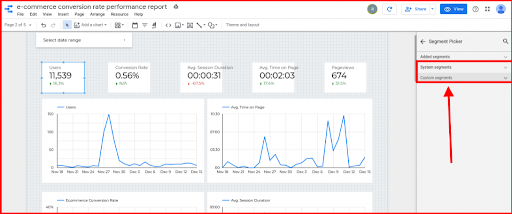
- Now you have to repeat this step with all the charts.
Here you have finally created your social marketing team performance report. Following are points regarding what these charts explain.
As a manager or holding a high position in a company, you just need to understand what the output is.
Explanations of the team performance report:
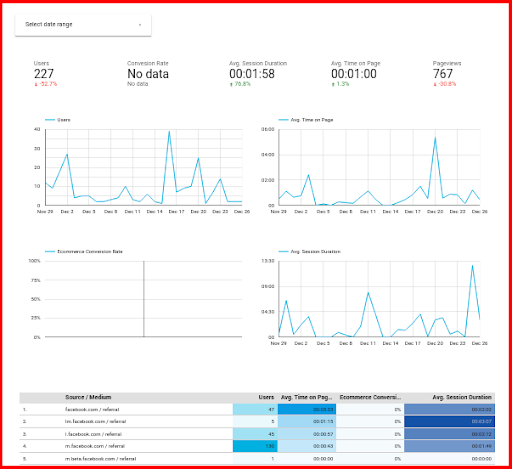
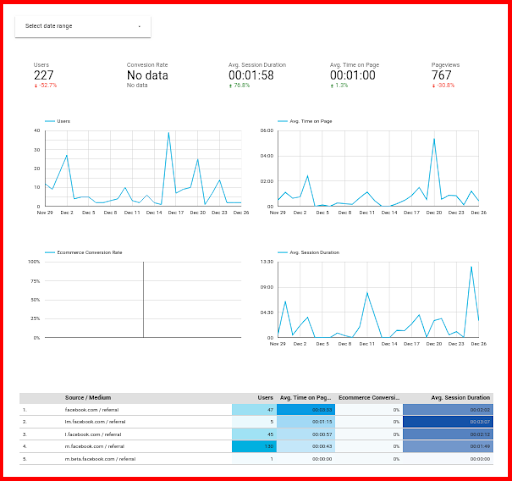
Scorecards
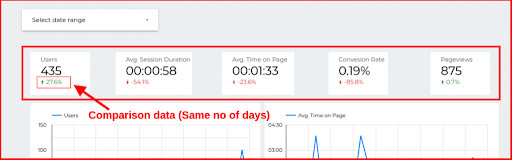
Here you can see the number of users coming from the social media platform and if the users are increased or decreased as compared with the past same number of days. So you can compare with weekly data or monthly data and can analyze the user acquisition.
Avg Session Duration and Avg. Time On Page
Improvement in the engagement of users is not enough, are the visitors spending enough time on your site or on a specific page is also an important aspect. Check and compare with the past data, but before that, you need to understand what is the ideal time spent on your site especially for the visitors who are visiting socially.
Note – Avg. Session Duration and Avg. Time on-page can differ for different sources and mediums. It totally depends upon the audience’s relevancy.
Conversion Rate
This is one of the most important metrics which directly reflect marketing performance management. It doesn’t matter that you are receiving tons of visitors every day if they are not relevant and not capable to convert. You should be totally aware of what is the normal conversion rate for the particular field you are analyzing and accordingly, you can discuss this with the respective team about this. For example, why is the conversion rate low, or what are the techniques you have to use to maintain this conversion rate?
Let’s move down to other charts!
Time Series Graph
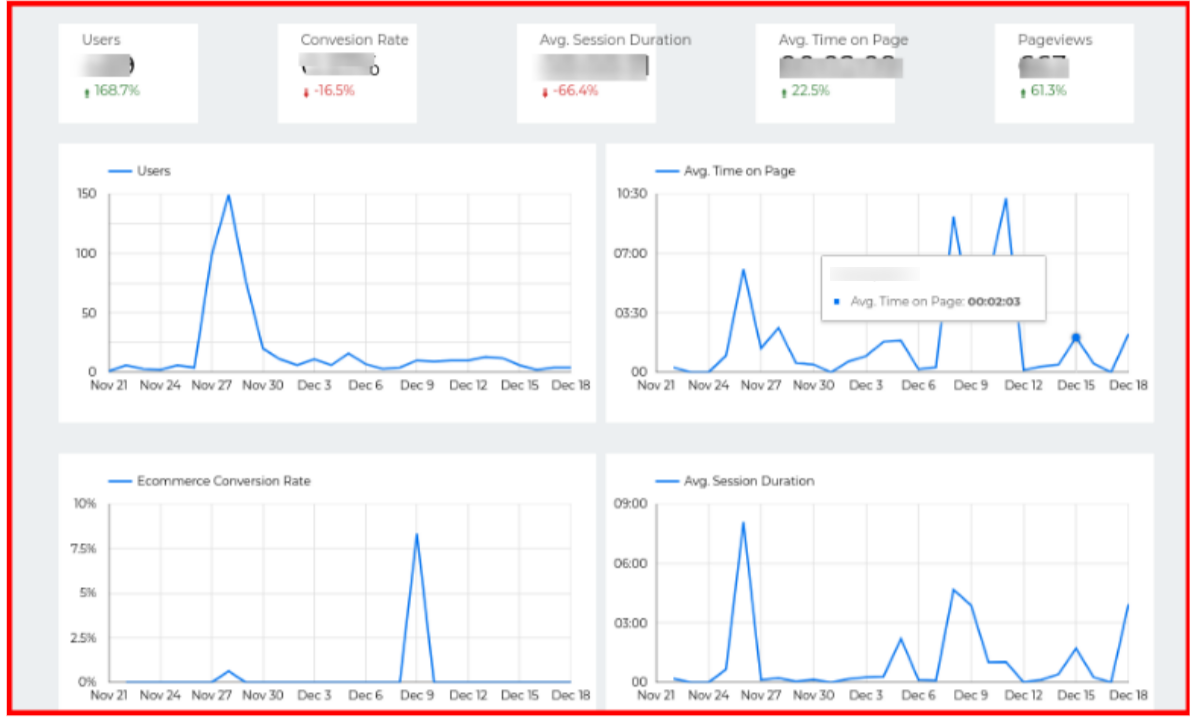
In this Data Studio Team Performance Report, these are the line charts explaining the same as above but still very helpful, why? Let me explain it to you!
In the above scorecard, you will only get the average value for the time frame you want to check, but with the help of this time graph chart, you can easily understand what the exact flow is like.
Why Is A Time-Series Graph More Reliable?
Check the 3rd line chart which is the conversion rate you can see that on 9 Dec the conversion rate is about 7.5% and the rest of the day it is about 0% but then in the scorecard, the average is about 0.40%, that’s a point you need to understand and that’s why I added this chart.
Scroll Performance And User Funnel
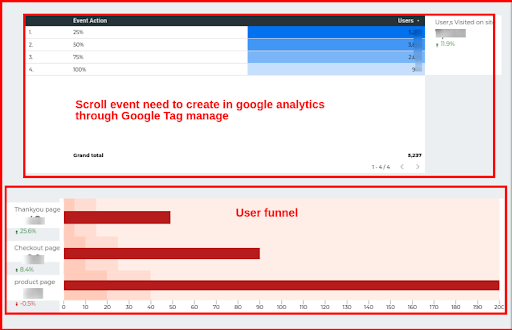
These 2 are informative dimensions for you to understand how users are behaving on your site, like what is your page performance? Are the content and structure friendly for the visitors? These points can be easily analyzed by the scroll event.
Check out my blog How to track content performance with Google Analytics (Unique Technique) In this blog, I explained why the scroll event is important and there is a link on how you can create it in Google Analytics.
If you want more information regarding this mention in the comments or contact us.
The second one is the user funnel. It basically helps you understand what is the flow of your visitors after landing on your site.
How Can Funnel Help?
Suppose visitors have landed on the product page and 50% of visitors have moved to the checkout page, and 5% of visitors have completed the purchase and moved to the thank you page. This is the performance of visitors coming from social media that can be different for visitors coming from organic or paid channels. This funnel can be different for different websites depending on how you are creating that in Google Data Studio.
Rest Of the Page
The structure of the rest of the page is that the Ads team performance page and the SEO team performance page are the same. You just need to use the segment (“need to create in google analytics”) to filter it in different fields. You can add more pages in this team performance report according to your needs like referral traffic performance, direct traffic performance, etc.
Final Words
This Google Data Studio Team Performance Report is helpful for you all to understand the overall performance without spending lots of time. I have used almost every possible dimension and metric that can help you understand the performance of different marketing segments so that you can discuss it with the respective teams.
You need to understand the performance of your individual team so that you can focus on a specific team that is not performing well or take some idea from the team that is the best performing.
If you want I can modify the team performance report according to your needs, just mention it in the comment section.


Great insights on using Google Data Studio for marketing team performance analysis! The article provides practical tips on visualizing metrics, setting KPIs, and optimizing workflow with clear, data-driven strategies. Very helpful for tracking and improving team efficiency!